












Tempe and Prague, Arizona, USA, October 28th / PRNewswire / -- Gen Digital Inc. (Nasdaq ticker: GEN) announced its financial results for the second quarter of the fiscal year 2027, as of October 2, 2026.
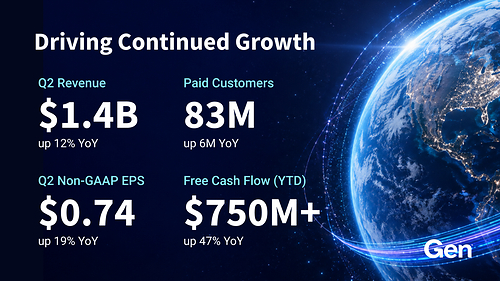
Gen CEO Vincent Pilette stated: "We have achieved double-digit growth in reservations for the sixth consecutive quarter. The number of customers has reached a record high, and at the same time, product engagement and retention rates remain strong. The innovations of each brand, as well as their continuous investment in the platform, are resonating with consumers. We are taking advantage of this momentum to expand the ways in which we help people protect and manage their digital and financial lives in an increasingly intelligent AI world."
Financial Highlights of the Second Fiscal Quarter of Fiscal Year 2027
GAAP Performance
- Revenues amounted to $1.369 billion, a year-on-year increase of 12%.
- Operating profit was $507 million, a year-on-year increase of 16%.
- Earnings per share after dilution are $0.48, a year-on-year increase of 122%.
- Since the beginning of the year, the operating cash flow has amounted to 760 million US dollars, representing a year-on-year increase of 45%.
Non-GAAP performance
- Pre-order volume of $1.347 billion, a year-on-year increase of 10%
- Revenues amounted to $1.369 billion, a year-on-year increase of 12%.
- Operating profit of $686 million, a year-on-year increase of 10%
- Earnings per share after dilution are $0.74, a year-on-year increase of 19%.
- Free cash flow from the beginning of the year to date is $753 million, a year-on-year increase of 47%.
Gen Chief Financial Officer Natalie Derse stated: "The results of the second fiscal quarter reflect the resilience of our business model, as well as the continued growth momentum of our two business segments. Customer demand is strong, and we have maintained discipline among investment, efficiency, and profit growth. This balance gives us the confidence to allocate resources to the most promising opportunities and to raise our full-year guidance once again. We will continue to focus on sustained execution and on creating long-term value for our customers and shareholders."
2027 Fiscal Year Third Quarter Non-GAAP Guidance
- Estimated revenue is between $1.365 billion and $1.39 billion.
- Expected earnings per share to be between $0.73 and $0.75.
Upward revision of non-GAAP guidance for fiscal year 2027
- Estimated annual revenue to be between $5.465 billion and $5.515 billion, with previous guidance ranging from $5.375 billion to $5.475 billion.
- Estimated annual earnings per share to be $2.93 to $2.98, with previous guidance ranging from $2.87 to $2.97.
Gen indicates that the earnings call for the second fiscal quarter of the 2027 fiscal year will be held on October 28th at 2 PM Pacific Time and 5 PM Eastern Time. Instructions for live webcast and dial-in can be found at Investor.GenDigital.com. A replay will be provided after the call. For more details on Gen performance and outlook, please refer to the financial section on the investor relations website Investor.GenDigital.com.
About Gen
Gen (Nasdaq ticker: GEN) is a global company dedicated to advancing digital freedom. Through trusted brands such as Norton, Avast, LifeLock, MoneyLion, and Engine, Gen helps people protect and take control of their digital and financial lives. As AI reshapes the way people discover, make decisions, and transact, Gen is building a layer of security and trust to help people and their smart agents navigate the digital world more safely. Gen supports nearly 500 million users in over 150 countries and regions with products and services that cover network security, online privacy, identity protection, and financial health. For more information, please visit GenDigital.com.
Forward-looking Statements
This press release contains forward-looking statements that may be defined under the U.S. Federal Securities Laws. In some cases, you can identify these forward-looking statements by words such as “expected,” “will,” “continue,” and similar expressions or their variations or negatives. However, the absence of such words does not mean that the statements are not forward-looking. Except for statements of historical facts, all other statements may be considered forward-looking, including but not limited to the quotations under “Financial Highlights for the Second Fiscal Quarter of 2027,” as well as expectations related to achieving long-term goals; the expectations for the third fiscal quarter of 2027 and non-GAAP revenue and non-GAAP earnings per share for the third fiscal quarter of 2027 under “Guidance for the Third Fiscal Quarter of 2027” and “Guidance for 2027,” as well as any assumptions on which the above content is based.
These statements are subject to known and unknown risks, uncertainties, and other factors that may cause actual results, levels of activity, performance, or achievements to differ significantly from those expressed or implied in this press release. Relevant risk factors include, but are not limited to: the completion of acquisitions or the expected impact thereof (including the ability to achieve synergies and related cost savings); asset divestitures, reorganizations, share repurchases, financing, debt repayments, and investment activities; the outcome or impact of pending lawsuits, claims, or disputes; difficulties in implementing the business operating model for consumer network security; direct customer investment returns falling below expectations; difficulties in retaining existing customers and converting existing non-paying customers into paying customers; difficulties and delays in reducing ongoing costs and realizing the full value of underutilized assets; the successful development of new products and upgrades and the degree of market acceptance of these new products and upgrades; the ability to maintain customer and partner relationships; expected growth in certain market segments; fluctuations in the company's stock price; the ability to successfully execute strategic plans; the vulnerability of the company's solutions, systems, websites, and data to intentional damage by third parties; changes in existing accounting standards or tax rules and practices; as well as general business and macroeconomic changes in the United States and globally, including economic recessions, the impact of inflation, fluctuations in foreign exchange rates, changes in interest rates or tax rates, and the impact of ongoing and new geopolitical conflicts and other global macroeconomic factors on the company's operations and financial performance. For more information regarding these and other risk factors, please refer to the risk factors sections in the company's most recent 10-K and 10-Q reports. The company advises readers to carefully read these sections.
In addition, there may be other unforeseen factors that are not described in the regular reporting documents, usually because the company deemed these factors to be unimportant at the time. However, these factors could also lead to significant differences between the actual results and the company's forecasts and expectations. All forward-looking statements should be evaluated with an understanding of their inherent uncertainties. The company assumes no responsibility and has no intention of updating these forward-looking statements due to future events or developments.
Use of non-GAAP financial information
The company uses operating profit margins, operating profits, net profits, and earnings per share that are not calculated using the GAAP methodology. These indicators are derived after adjustments to the GAAP results, and certain expenses, revenues, and losses are excluded. The company also provides financial indicators such as non-GAAP revenues and revenues at fixed exchange rates. These non-GAAP financial indicators are intended to help users better understand the company's past financial performance and future prospects, and by adjusting items that affect comparability over time, they provide a more meaningful comparison between current and historical performance. Management also uses these non-GAAP financial indicators to evaluate the performance of Gen, as well as to plan and forecast for future periods. The non-GAAP financial indicators are not calculated in accordance with the GAAP standards, and the company may use different calculation methods from other companies. Non-GAAP financial indicators are provided for supplementary information only and should not be considered a substitute for the GAAP financial information. They should be read in conjunction with the concise consolidated financial statements prepared in accordance with the GAAP. Readers are advised to refer to the adjustment table attached to the quarterly earnings announcement, which shows the non-GAAP indicators and their comparison with the GAAP results. This table, along with other financial information including the performance presentation, can be found on the company's investor relations website at Investor.GenDigital.com. Since most of the non-GAAP adjustments involve events that have not yet occurred, this press release does not include an adjustment table for the non-GAAP revenue and earnings per share guidance ranges. As predicting such adjustments is too cumbersome, the company is unable to provide accurate estimates.
GEN DIGITAL INC. Appendix A: Explanation of Non-GAAP Indicators and Other Items
Purpose of indicators that are not GAAP:The company believes that presenting non-GAAP financial indicators in conjunction with the corresponding GAAP financial indicators can provide meaningful supplementary information regarding the company's operational performance for the following reasons: Management utilizes these non-GAAP financial indicators when evaluating performance and planning and forecasting for future periods. Given the importance of these indicators in business management, the company also uses them in the assessment of management compensation. These non-GAAP financial indicators are not calculated in accordance with GAAP; therefore, the calculation methods adopted by the company may differ from those of other companies. Non-GAAP financial indicators are intended to serve as supplementary information only and should not be considered a substitute for GAAP financial information. They should be read in conjunction with the consolidated financial statements prepared in accordance with GAAP.
Equity Incentives:This includes restricted stock units for employees, performance-based rewards, stock options, and expenses related to employee stock purchase plans, all of which are determined according to GAAP. The company also evaluates its performance with and without these items, as equity incentives are non-cash expenses that can vary significantly depending on the timing, scale, nature, and design of the grants, and are partly affected by factors beyond the company's control, such as fluctuations in the market value of common stocks. In addition, for ease of comparison, the company believes that disclosing financial indicators GAAP that exclude equity incentives helps to compare the company's performance with that of other companies within the industry.
Amortization of intangible assets:Amortization of intangible assets includes the amortization of intangible assets related to business combinations, such as developed technologies, customer relationships, and goodwill acquired through acquisitions. In the GAAP financial statements, the company recognizes the amortization of these intangible assets as part of revenue costs and operating expenses. According to purchase accounting, the company must allocate a portion of the purchase price to the acquired intangible assets and amortize it over their estimated useful life. However The purchase price allocated to these assets does not necessarily reflect the costs incurred internally by the company in developing those intangible assets. Furthermore, the amount of amortization expense for acquired intangible assets varies and is significantly affected by the timing of the acquisition and the valuation at the time of acquisition. The company excludes these expenses from its non-GAAP operating results in order to assess current operating performance and to better compare it with past operating performance.
Reorganization and other costs:Reorganization costs are expenses related to the formal reorganization plan, which mainly include employee severance and benefits arrangements, contract termination costs, asset write-offs, as well as other exit and disposal costs. Other exit and disposal costs include facilities closure and integration costs associated with the reorganization event. The company excludes these reorganization and other costs from the non-GAAP results because it considers these costs to be incremental expenses that are outside of the core activities of daily operations and do not reflect current operational performance; excluding these expenses helps to assess current operational performance more meaningfully and to compare it with historical performance.
These expenses represent the transaction and business integration costs associated with significant acquisitions and are recorded as operating expenses in the GAAP financial statements. Such costs include incremental expenditures incurred to complete the business merger, such as consulting, legal, accounting, valuation, and other professional or advisory fees. The company excludes these costs from the non-GAAP results because they are not directly related to the company's business operations; moreover, the company believes that the non-GAAP financial indicators, which exclude these costs, can more accurately reflect the company's expenditure trends. In addition, these costs vary depending on the scale and complexity of the acquisition and cannot be used to represent the costs of future acquisitions.
Non-cash interest expenses and amortization of debt issuance costs:In accordance with GAAP, the company treats the value of the conversion features in the convertible notes separately as a debt discount, reflecting the assumed interest rate of the non-convertible debt. The company amortizes this discount and the debt issuance cost over the relevant debt period. The company excludes the difference between the calculated interest expense and the interest payments on the coupons, which includes the amortization of the conversion features and issuance costs. On August 15, 2022, the company settled the remaining convertible debt. In fiscal year 2023, the company also began to amortize the debt issuance costs associated with the senior credit arrangements obtained upon the completion of the acquisition of Avast. The company believes that excluding these costs allows for a more meaningful reflection of the cash cost of the debt instruments and enhances investors' ability to understand the company's performance from a management perspective.
Debt settlement income (loss):The company records the gains or losses arising from debt settlement. Gains or losses refer to the difference between the fair value of the consideration exchanged and the carrying amount of the debt liability on the debt settlement date. The company excludes gains or losses from debt settlement in non-GAAP results, as these do not reflect the ongoing operations of the business.
Changes in fair value and impairment of unlisted equity investments:The company recognizes unrealized and realized gains or losses from equity investments in private enterprises. The company excludes these net gains or losses as they do not reflect the ongoing operations of the business.
Gain (loss) from the sale of properties and non-financial assets:The company regularly confirms the gains or losses arising from the sale of land, buildings, and non-financial assets. The company excludes these gains or losses as they do not reflect the ongoing operations and business results.
Impact and Adjustment of Income Tax:The non-GAAP tax rates adopted by the company exclude: (1) the specific impacts of changes in tax legislation; (2) most other significant special items; (3) unrealized gains or losses arising from the re measurement of deferred tax items denominated in foreign currencies and uncertain tax benefits; and (4) the impact of income tax resulting from non-GAAP adjustments to the aforementioned operating results. The company believes that these adjustments facilitate a better assessment of current operating performance and comparison with past results. Tax rates may change for various reasons, such as significant changes in the regional profit structure due to acquisitions and divestitures, or fundamental changes in the tax laws of the company's main operating jurisdictions.
After dilution, the weighted average number of outstanding shares of GAAP and non-GAAP is usually the same, except during periods of ongoing operating losses. According to GAAP, during such periods, the company does not disclose the dilutive effect using the GAAP metric. However, if there is non-GAAP net profit, the company will disclose the dilutive effect on the number of outstanding shares based on non-GAAP. This amount is equivalent to the dilutive effect that would have been disclosed if the company had achieved GAAP profit during that period.
Reservation volume:Reservation volume refers to customer orders that are expected to generate net revenue in the future. The company discloses this operational indicator because it reflects customers' demand for the company's products and services and helps readers analyze the company's performance in future periods.
Free Cash Flow:Free cash flow is defined as the cash flow generated from operating activities minus expenditures on the acquisition of property and equipment. Free cash flow is not a financial indicator under the GAAP framework, nor does it reflect the company's future contractual commitments or the total increase or decrease in cash balances over a certain period. Therefore, it should not be considered as an alternative indicator of operating cash flow or a measure of liquidity.
(Leveraging reduction) Free cash flow:Free cash flow is defined as the cash flow generated from operating activities minus expenditures on the acquisition of property and equipment. Deleveraged free cash flow does not include net cash interest expenses (after deducting amounts received through interest rate swaps). Free cash flow is not a financial indicator under GAAP, nor does it reflect the company's future contractual commitments or the total increase or decrease in cash balances over a certain period. Therefore, it should not be considered as an alternative indicator of operating cash flow or a measure of liquidity.
Cybersecurity Platform:Including the company's security and privacy products, as well as comprehensive network security suites that provide technical solutions and stronger threat protection, to help people use the digital world safely, privately, and with confidence.
Trust-based solutions:Including identity, reputation, and financial health products, we provide innovative solutions and insights to help consumers confidently grow and manage their identity, reputation, and finances.
Direct income:Direct revenue reflects income from subscriptions sold directly through e-commerce or mobile channels, as well as income generated from financial transactions completed directly through Gen's own platform or market.
Partnership Revenue:Partnership revenue reflects income from various sources and channels, including retailers, employee benefits, telecommunications operators, publishers, and strategic partners, and also includes product usage revenue or product sales revenue generated through their financial markets.
Paid Customers:The company defines paid customers as active users of its products and solutions, including those who have valid paid subscriptions at the end of the reporting period. Paid customers also include those who possess unique accounts and have made at least one revenue-generating transaction within the relevant active period for their respective product categories, whether through the company's first-party personal financial products, transactions conducted in its financial markets, or revenue generated from product usage. The company does not include free trial users or those who have not actively transacted during the relevant period for their respective product categories. In order to accurately reflect the customer base that contributes to revenue, given the dynamic nature of consumers and the company's product portfolio, the company's methodology may be adjusted from time to time. The methods used to measure these indicators require judgment, and the company regularly reviews these indicators to improve their accuracy. However, the company's ability to recalculate historical indicators may be affected by data limitations or other factors, hence different methods may need to be employed for adjustment. The company generally has no intention of updating any previously disclosed indicators that are found to be inaccurate or not material.