















Brief Review
- Shiba Inu ( SHIB ): Hanging around $0.00000508 under bearish pressure, with resistance levels between $0.00000530 and $0.00000550, and support level at $0.00000500.
- Dogecoin ( DOGE ): Trading around $0.07958 in a continuous downtrend, with resistance levels between $0.0850 and $0.0880, and support levels near $0.0780.
- XRP: Trading around $1.3045, below its downward long-term moving average of around $1.38. Support level is at $1.30, and resistance level is at $1.35.
- Binance Coin ( BNB ): Trading around $743.70, above the longer-term trend indicators. Support levels are between $710 and $720, while resistance levels are between $750 and $760.
Shiba Inu ( SHIB ) Rebound limited by bearish pressure
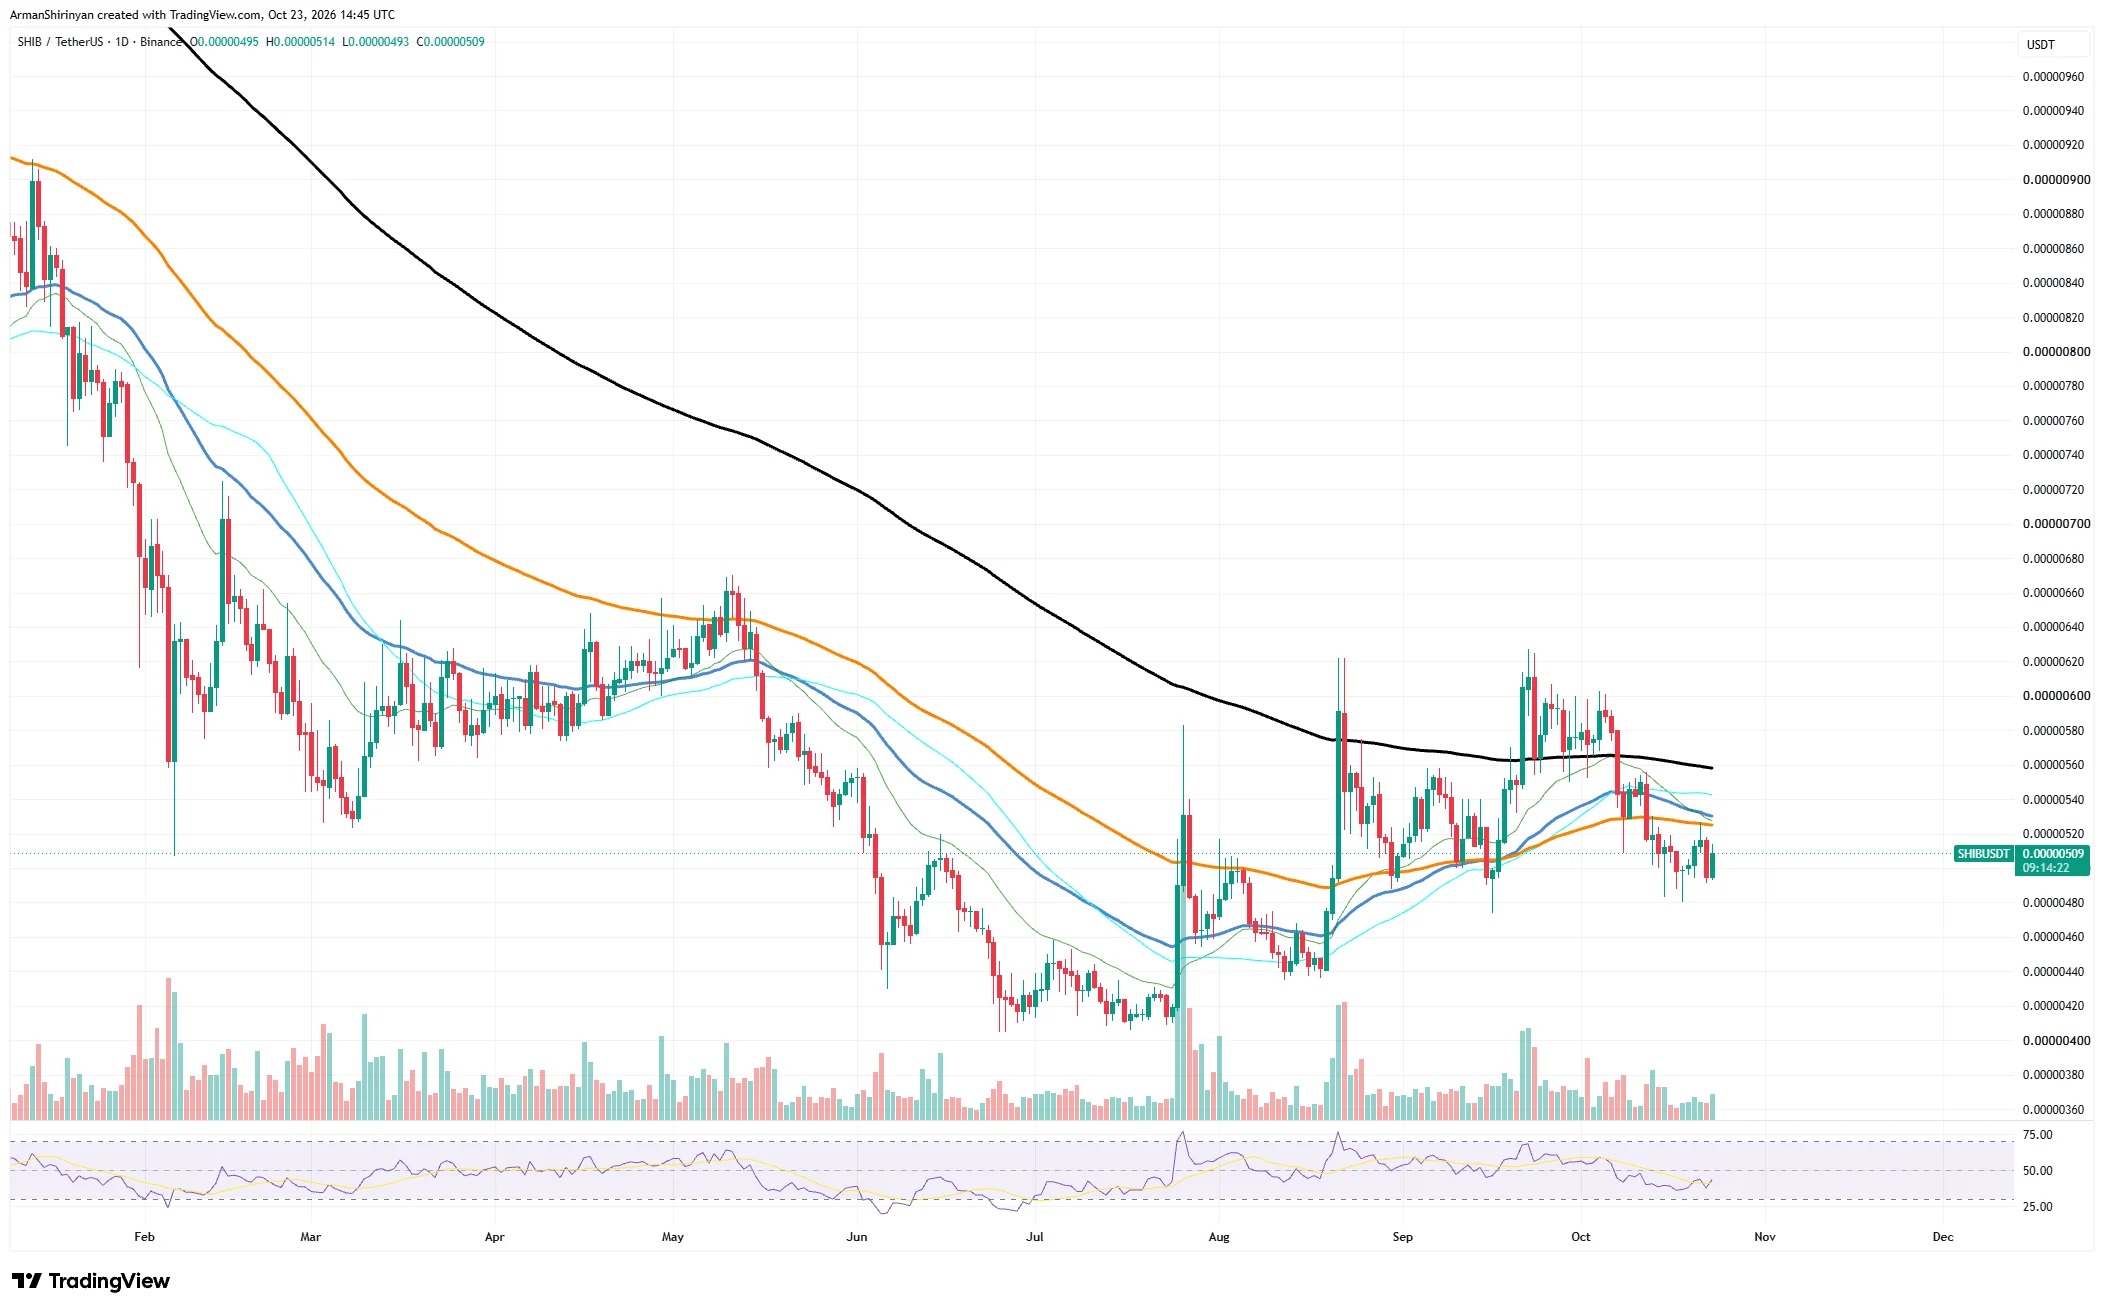
Shiba Inu ( SHIB ) continues to face bearish pressure on the daily chart. After failing to hold onto recent rebounds, the token has been hovering around $0.00000508. The broader market structure remains fragile, as evidenced by lower highs and significant moving averages continuing to act as resistance.
The current resistance range is between $0.00000530 and $0.00000550, where several short-term moving averages converge. If a sustained breakthrough above this area is achieved, buying pressure could push prices up to $0.00000580, followed by the psychologically significant level of $0.00000600. However, the downward long-term moving averages continue to reinforce a more bearish outlook.
Looking below, $0.00000500 is the current psychological support level. Once this level is breached, SHIB could further decline to $0.00000470 and $0.00000450.
The Relative Strength Index ( RSI ) remains below the neutral 50 level, indicating that despite some signs of stabilization, bearish momentum still dominates. After the previous fluctuations, trading volume has also declined, showing limited confidence among buyers. Unless SHIB manages to re-establish itself above the nearby moving averages with stronger trading volume, the token may face further pressure. If it can clearly break through $0.00000550, it might indicate that short-term sentiment is beginning to improve.
Dogecoin ( DOGE ) continues the downward trend
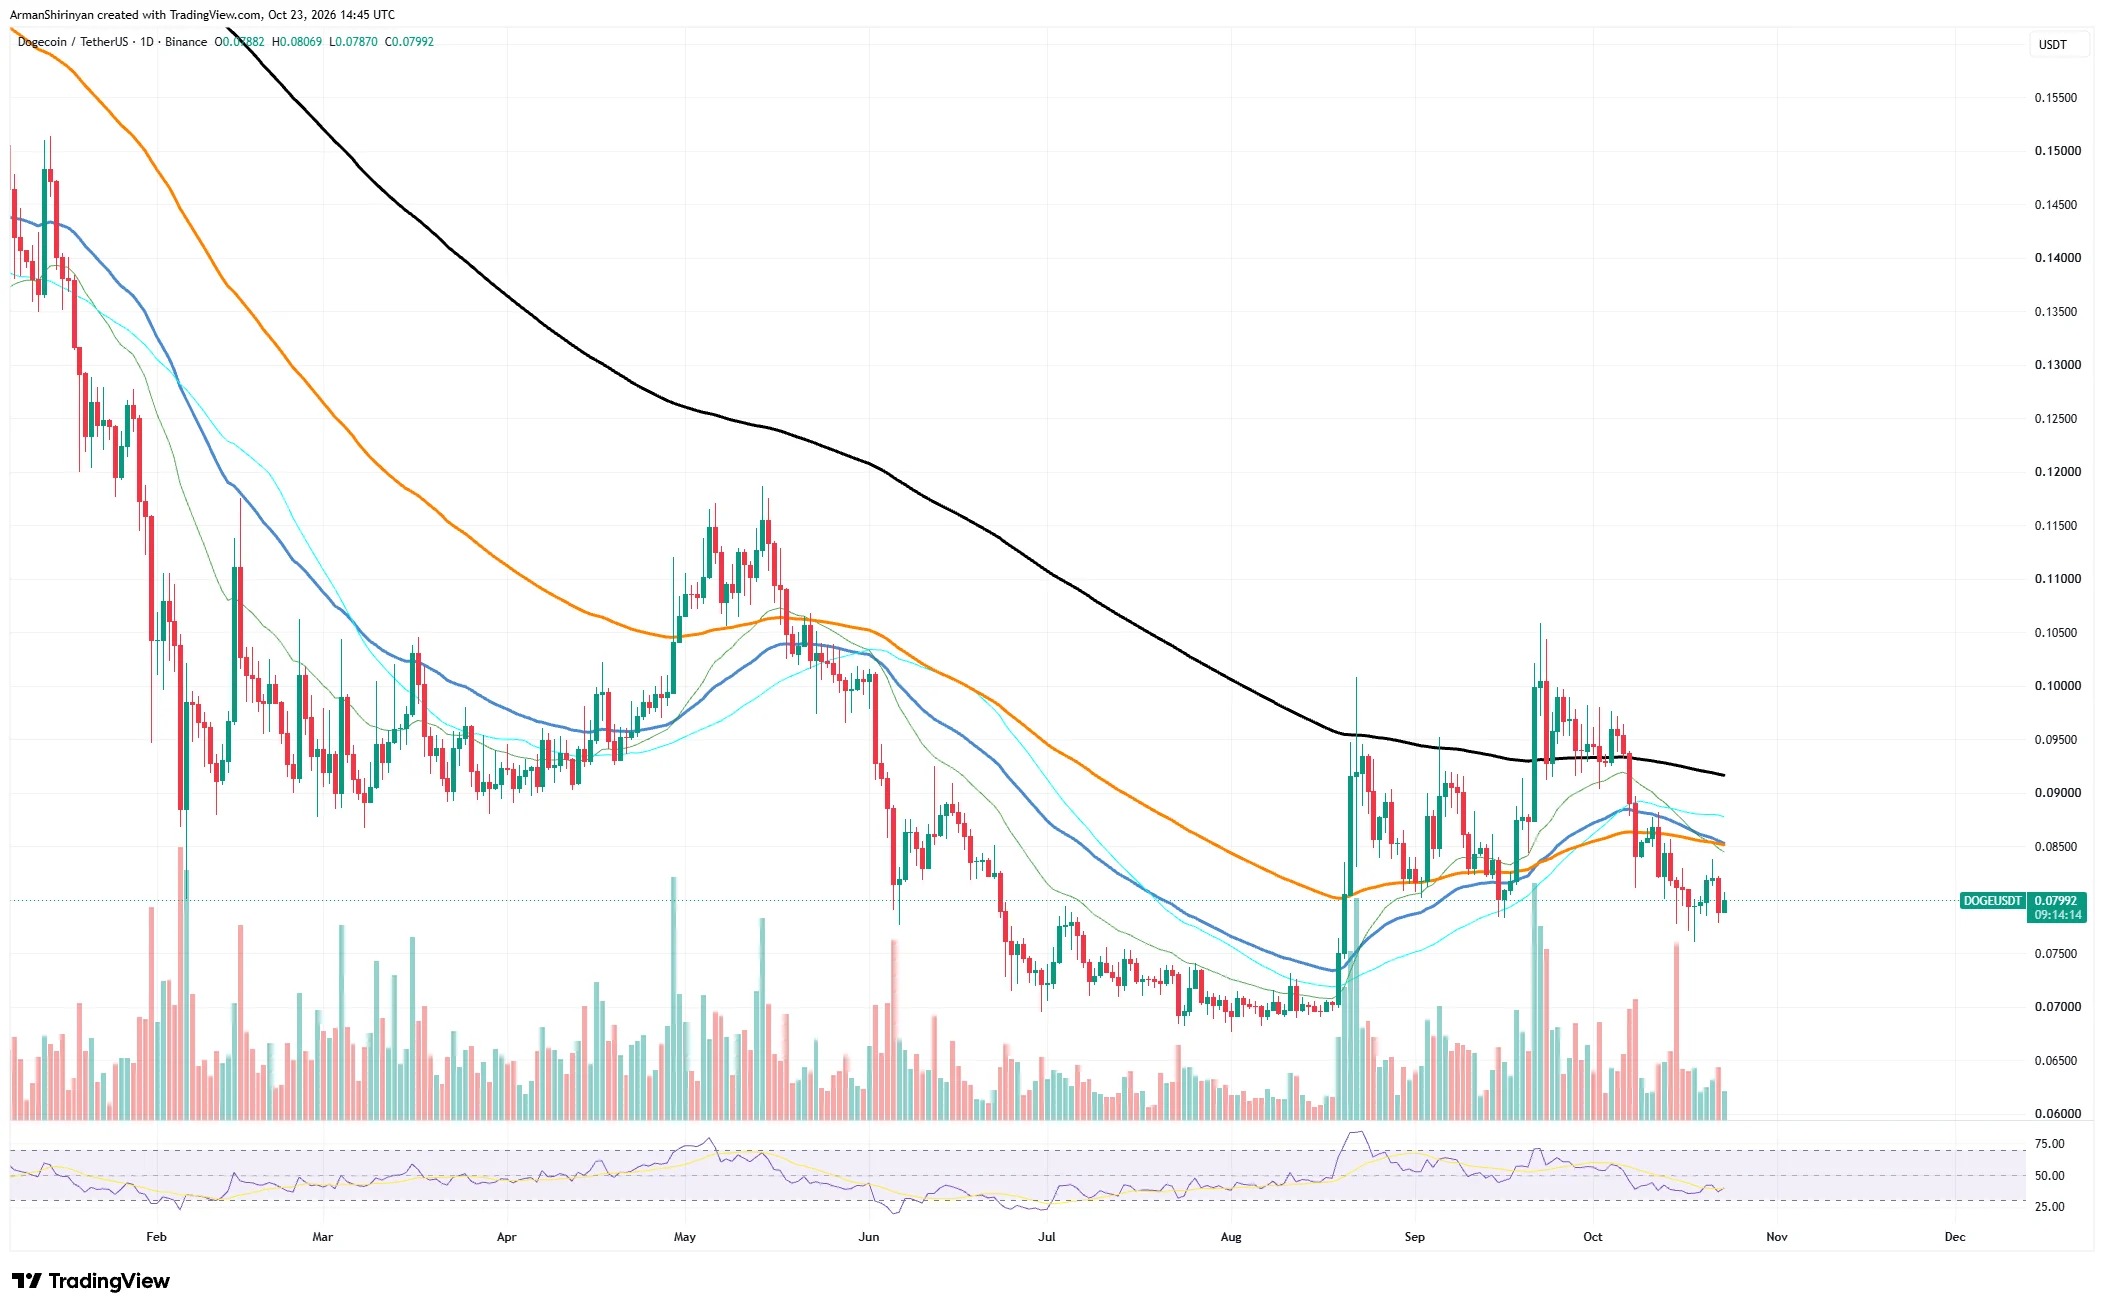
Dogecoin ( DOGE ) continues to face significant selling pressure, trading around $0.07958 on the daily chart, with bearish momentum continuing to dominate the trend. Since 2025, this cryptocurrency has been in a continuous downward trend, and multiple attempts at rebounding have failed to generate sustained upward momentum. Recently, it encountered resistance around $0.1000, further reinforcing the current bearish outlook and causing DOGE to break below several key moving averages.
The current resistance range is between $0.0850 and $0.0880, where both the short-term and medium-term moving averages converge. If a decisive breakthrough can be made through this area, prices could open up space towards $0.0920; however, the downward long-term moving average at this level constitutes another significant obstacle.
Further up, the psychologically significant level of $0.1000 remains a key target that any meaningful rebound must overcome. Looking below, the current support level is around $0.0780, followed by $0.0750. If prices continue to fall below these levels, selling pressure may accelerate, and prices could drop to $0.0700 – a region that attracted buying interest during the summer consolidation phase.
The Relative Strength Index (RSI) (RSI) has been hovering in the lower half of the neutral range, indicating weak buying momentum, but it has not yet entered a state of severe oversold conditions. At the same time, the decline in trading volume after recent fluctuations suggests that market participants remain cautious about aggressive bullish positions.
XRP remains seller-dominated below $1.38
XRP continues to face bearish pressure on the daily chart, trading around $1.3045. After pulling back from higher resistance levels earlier on, sellers still hold the upper hand. Although the token has rebounded strongly from around $1.00, its August lows, its upward momentum has been difficult to sustain, and the current decline has caused the price to break below several key moving averages.
The broader technical structure remains unclear, especially since XRP is currently operating below the long-term downward moving average of $1.38. This level represents a significant obstacle for buyers attempting to reverse the current downtrend. At the same time, recent rejections in the $1.50 to $1.60 range also indicate that selling pressure remains evident whenever prices approach higher levels.
The current resistance level is around $1.35, followed by the range of $1.38 to $1.40, where multiple moving averages converge. If a sustained breakthrough above this range can be achieved, the buying momentum may increase, and there could be potential for gains towards $1.45 and $1.50. However, XRP requires stronger trading volume and several consecutive days of closing prices at these levels to confirm a meaningful bullish reversal.
Looking below, $1.30 is the current psychological support level. If it breaks below this level, XRP could further decline to $1.25, followed by the important $1.20 support area. If selling pressure intensifies, the wider range of $1.10 to $1.15 might become the next target.
Recent trends indicate that buyers are attempting to stabilize the market, but the rebound strength is limited. Compared to previous breakout phases, trading volume has also decreased, suggesting a weakened level of participation. Unless XRP successfully reclaims the resistance range between $1.38 and $1.40, the short-term outlook remains cautious, with a greater likelihood of consolidation or further decline.
Binance Coin ( BNB ) remains above key trend indicators
Binance Coin ( BNB ) shows signs of stabilization on the daily chart, currently trading around $743.70, after falling from a recent high near $800. Unlike many other major cryptocurrencies that are still below their long-term moving averages, BNB remains above key long-term trend indicators, indicating that its broader recovery structure is still relatively healthy.
This cryptocurrency began to show a strong bullish reversal in August, climbing from around $580 to near $800 at the end of September and the beginning of October. However, profit-taking near this resistance level triggered a pullback, with prices falling back to around $720. Buyers have recently been attempting to regain the initiative.
The current resistance level is between $750 and $760, a range that has influenced price movements several times recently. If this range can be continuously broken through, it may attract buying interest again, pushing BNB towards $780 and the psychologically significant level of $800.
If it can successfully reach $800, that would strengthen the bullish outlook and indicate that a broader upward trend is likely to continue. Looking below, the initial support level is around $730, followed by the $710 to $720 range. This area is an important short-term demand zone where buyers have previously intervened.
The Relative Strength Index (RSI) (RSI) hovers around the neutral level of 50, indicating that the forces of bulls and bears are relatively balanced. This means that BNB is neither significantly overbought nor significantly oversold, leaving room for a directional breakout to occur.
At the same time, the recent consolidation around $740 indicates that the selling momentum may be weakening after this latest round of pullbacks. However, buyers still need to demonstrate stronger confidence through higher trading volumes. As long as BNB holds above the $710 to $720 range, the broader recovery structure remains intact. A decisive break above $760 could provide an important bullish confirmation for the next round; conversely, if the support level near there cannot be held, it may lead to a deeper level of consolidation.