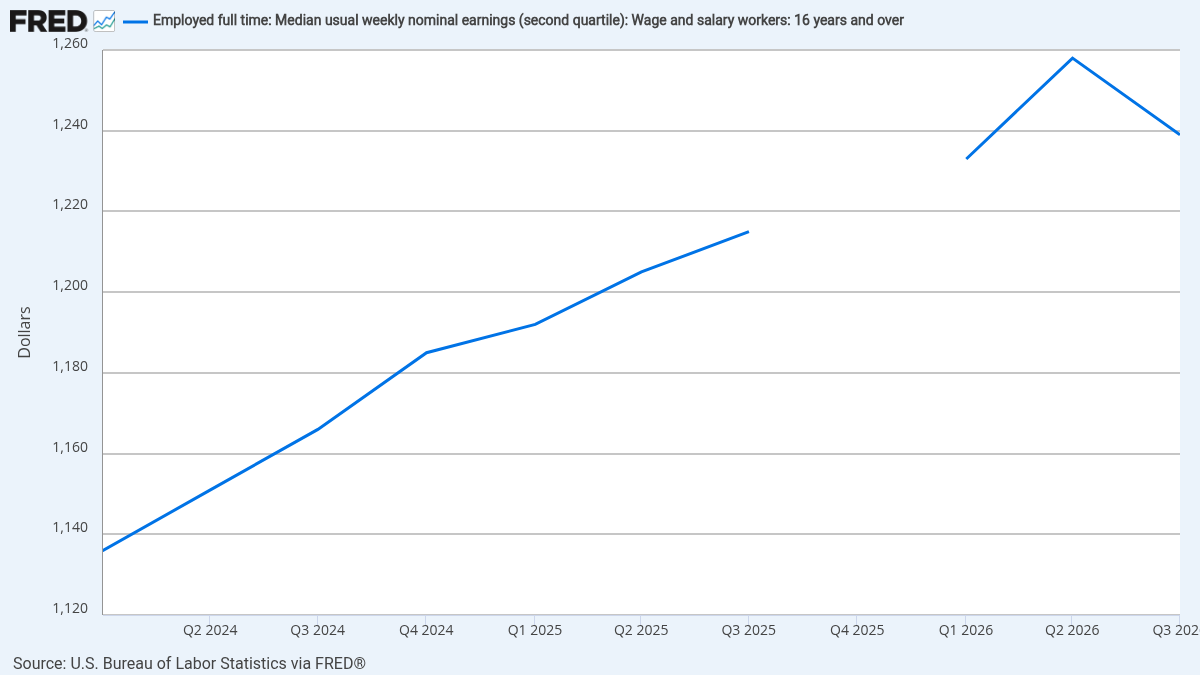
















The U.S. Bureau of Labor Statistics released data on "usual weekly earnings" for the third quarter of 2026 on October 21st, which showed that the median weekly wage for full-time employees with wages and salaries was $1,232, representing a nominal year-over-year increase of 1.5%. During the same period, the Consumer Price Index rose by 3.5% year-over-year. By comparing these two increases, one can see an obvious trend: while the wages of typical full-time employees have increased, the rate of increase has not kept up with overall prices. This comparison should not be interpreted as a decrease in everyone's actual income, nor can it be equated with the disposable income of all residents; it describes the relationship between the median income of the surveyed population and overall price changes.
The survey for that quarter covered approximately 122.2 million full-time employees with wages and salaries. The median ranks the population in the middle; unlike the average, it is not directly inflated by a small number of individuals with extremely high salaries. Therefore, it is suitable for observing the wage position of “typical” employees, but it cannot reveal all the changes at both ends of the income distribution. More importantly, this statistic, which is usually calculated on a weekly basis, uses nominal amounts. To discuss purchasing power, one must also take into account prices during the same period. When readers see the phrase “wage growth,” they should first ask whether the growth is nominal or real growth after adjusting for inflation.
Why is it necessary to consider both the scope and the price when looking at a set of salary data?
The announcement from the Bureau of Labor Statistics compares the year-over-year wage growth rate with the CPI increase. In a rough year-over-year comparison, the 1.5% nominal weekly wage increase is about two percentage points lower than the 3.5% price increase, but this does not represent an accurate measure of the real cost of living for each employee. Different families purchase different goods and services, and the proportion of expenses for rent, transportation, healthcare, and food also varies; the overall CPI is merely a unified reference point. A more precise statement would be that, measured by overall prices, the year-over-year increase in median nominal wages is not sufficient to offset the price increases during the same period.
Another difference is that this is not a tracking of wages for the same group of people over four consecutive quarters. The median wage will move as the employment structure changes: if high-income industries hire more workers, even if there are no salary increases for existing positions, the overall median may rise; if low-income positions decrease, the statistical median will also be mechanically raised. Conversely, an increase in new hires may lower the median, but the salary increases for those already employed do not disappear. Therefore, one cannot judge the wage negotiation results of each industry based solely on this figure, nor can it be considered a direct indicator of labor productivity.
The data also provides seasonally adjusted observations. The median weekly salary after adjustment is $1,239, compared to $1,258 in the previous quarter. The month-over-month change does not contradict the year-over-year nominal growth: seasonally adjusted data attempts to eliminate seasonal patterns by comparing adjacent quarters; the figure of $1,232 and its year-over-year increase are based on unadjusted figures. Mixing these two sets of data into one line can artificially create the illusion of a “sudden plunge” or “continuous rise” in wages. When reporting such data, it is more important to clarify the time period and whether the data is seasonally adjusted than to simply select the figures that make the most emotional impact.
The Bureau of Labor Statistics also reported that the median weekly wage for full-time female employees was $1,127, and for male employees it was $1,352, with a ratio of about 83.4% between females and males. This raw ratio reflects the overall wage gap among the surveyed population and does not account for factors such as job type, hours worked, experience, and industry when calculating equal pay for equal work. To discuss how this gap is formed, further research into factors such as occupational distribution, promotion, and working hours is needed. Interpreting this raw ratio directly as being caused by a single factor is beyond the evidence provided in this press release and is not conducive to understanding the true structural issues.
What does the divergence between wages and inflation mean for consumption and policy?
Family consumption depends not only on wage increases but also on job stability, working hours, savings, credit costs, and after-tax income. The slower growth in the median weekly wage compared to prices indicates that typical full-time employees are facing pressure on their purchasing power on paper; however, if a family has a second source of income, asset returns, or transfer payments, their actual spending capacity may be different. Conversely, families that bear high rent or debt interest may feel greater pressure even if their wages are slightly above the median. Macroeconomic data cannot replace a family's balance sheet.
There is also a dual nature on the corporate side. The pressure on consumers' purchasing power may weaken some discretionary consumer demands; however, a slowdown in wage growth could reduce the labor cost per unit for businesses. The ultimate outcome still depends on productivity, pricing power, and industry competition. The service sector, which is labor-intensive, is more directly affected by wage changes; capital-intensive industries may not be the same. When observing the next few quarters, it is advisable to consider weekly wages together with employment levels, average working hours, and price changes, rather than relying solely on a median figure to predict an immediate economic turnaround.
For monetary policy, wage data is important information, but it is not a trigger that automatically determines interest rates. Decision-makers typically also consider the breadth of inflation, unemployment, job vacancies, productivity, and inflation expectations. If wage growth is slow while prices remain high, there may be an uncomfortable combination in policy discussions: the purchasing power of salaried workers is eroded, yet it cannot be assumed that the inflation risk has been eliminated just because wages are growing moderately. Conversely, if prices later fall, even if nominal wage growth is not fast, real purchasing power may improve.
What is most noteworthy about this announcement is not the isolated figure of $1,232, but rather three key boundaries: it represents the median salary for full-time employees, not the overall income of the population; 1.5% is a nominal year-on-year increase, not real purchasing power; and 3.5% CPI is a reference for overall prices, not the inflation rate specific to each household. By maintaining these boundaries, we can consider the statement "salaries have increased but not kept up with prices" as a verifiable economic assessment, rather than an exaggerated headline. If the relationship between these two figures changes in the future, it should be re-evaluated using the updated official data, and the findings from this quarter should not be extended to draw conclusions about the long term.