

Ethereum prices fell nearly 6% on October 15 to around $2,350, following stronger-than-expected U.S. inflation data that triggered a large-scale sell-off. Within an hour, more than $106 million in long positions of ETH were liquidated on Binance.
On Thursday, as hotter inflation data from the United States triggered a widespread sell-off in the cryptocurrency market, Ethereum's price fell by nearly 6%.
Analysts CryptoQuant and Darkfost reported that on Wednesday, within the last hour, there were $106 million in Ethereum long liquidations. Binance
Government data shows that in September, U.S. consumer prices rose by 0.6% month-on-month, and the year-on-year inflation rate reached 3.7%.
Daily indicators show that Ethereum RSI is approaching 34, and traders are closely monitoring the potential support around $2,300.
Darkfost indicates that this liquidation event occurred after the release of the Consumer Price Index ( CPI ) on Wednesday, which showed that inflation in the United States accelerated in September. He described this sell-off as the largest Ethereum hourly long liquidation event in Binance of the past six months. The analyst linked the large-scale trading losses to rising leverage levels and concerns about further interest rate hikes by the Federal Reserve.
Hot CPI triggers $106 million in liquidations, Ethereum price falls
After the U.S. inflation report in September exceeded market expectations, Ethereum prices faced a sharp sell-off, forcing traders to close their leveraged positions as prices dropped.
Darkfost stated that within one hour after the data was released, more than $106 million in ETH long positions on Binance were liquidated. This figure refers to the value of the leveraged positions that were closed, not the actual cash amount lost by individual traders.
The analyst stated that after the inflation data was released, the price of Ethereum fell from around $2,500 to $2,350. He estimated that during the period he observed, the correction was approximately 7%.
According to CoinGecko data, the trading price of ETH is approximately $2,350, with a decrease of 5.99% in the past 24 hours and a decrease of 8.31% in the past 7 days.
Calculated at this price, Ethereum has a market value of approximately $286.9 billion, and the trading volume of cryptocurrencies in the past 24 hours was about $18.37 billion.
During the decline, some market reports indicated that ETH briefly fell to around $2,315, marking the lowest level reported for this cryptocurrency since its rebound in August.
During this liquidation event, traders who borrowed funds to bet on an increase in Ethereum prices encountered automatic margin calls.
When the leverage position incurs excessive losses, the exchange may close it to prevent losses from exceeding the available collateral. This can lead to increased trading activity during sudden market declines.
Darkfost said that during the period he observed, the trading volume of Ethereum derivatives was approximately 9 times that of spot transactions.
In his view, this difference increases the market's sensitivity to sudden price fluctuations, especially when traders using high leverage respond to economic announcements.
The $106 million liquidation event he mentioned specifically refers to the long positions on ETH within one hour on Binance; it should not be confused with the total cryptocurrency liquidation amount across all exchanges over a 24-hour period.
U.S. inflation rises, investors await the Fed's decision
The U.S. Bureau of Labor Statistics confirmed that the Consumer Price Index rose by 0.6% month-on-month in September, higher than the 0.4% increase in August.
Darkfost The consensus forecasts cited show that economists originally expected an increase of about 0.5%.
The year-on-year inflation rate rose from 3.4% in August to 3.7%. Excluding food and energy prices, the core CPI year-on-year increase was 2.6%, higher than the previous month's 2.4%.
Energy prices accounted for a large portion of the increase in that month. According to a report from the U.S. Bureau of Labor Statistics, gasoline prices rose by 9.1% in September, contributing to more than half of the overall monthly CPI increase.
In the past 12 months, gasoline prices have risen by 34.2%, and fuel prices have increased by 74.2%. The energy index has also risen by 20.4% year-on-year.
Price increases are not limited to energy. In September, housing costs rose by 0.4%, and air ticket prices increased by 1.2%.
This inflation report has prompted investors to re-evaluate the Federal Reserve's interest rate prospects.
Darkfost It is estimated that market expectations for another interest rate hike have risen from around 17% in the past week to nearly 30%.
This figure reflects the analyst's judgment on market pricing, rather than the decisions that have already been announced by the Federal Reserve.
Higher interest rates can change the relative attractiveness of investments, especially when traders use borrowed funds to hold positions.
The next scheduled policy decision by the Federal Reserve is on October 28th, and the government plans to release the October CPI data on November 10th.
Ethereum traders face ETF capital outflows and short positions
The decline of Ethereum has also drawn renewed attention to institutional investment flows and derivatives positions in the market.
In the United States, after spot Ethereum ETF attracted approximately $24.8 million on October 13, data for the available ETF on the following trading day showed a outflow of funds.
Previous reports on the redemption of Ethereum ETF and the capital flow of crypto funds showed that from October 5th to 9th, a total of approximately $1.29 billion flowed out of tracked US crypto investment products. The withdrawal of funds coincided with the period when Ethereum struggled to maintain higher prices.
Meanwhile, derivatives traders continue to bet on a decline in the price of ETH.
Cryptography analyst Daan Crypto Trades reported that short positions increased when Ethereum declined following the inflation announcement.
A short position refers to a trade that profits from a decline in asset prices. Traders holding such positions may face losses if the price rises significantly.
Daan describes these positions as remaining relatively stable during the downward trend, indicating that some traders are still maintaining short positions.
Blockchain monitoring account Onchain Lens has identified approximately $75 million in short positions on the decentralized derivatives platform Hyperliquid that are related to market maker Wintermute.
Its report shows that Ethereum is one of the larger positions among them.
These positions represent a snapshot of a trade. As traders adjust their exposures, their size and direction may change.
After the sell-off, can Ethereum's price hold at $2,300?
As Ethereum approaches the $2,300 range, daily technical indicators show that selling pressure continues.
The attached chart shows that ETH is around $2,354.50, which is below the lower band of the Bollinger Bands at approximately $2,362.90.
The Bollinger Bands are used to measure the degree of deviation of prices from the recent average. When prices fall below the lower band, it indicates that they have fallen outside the usual lower limit of the indicator.
Ethereum is still significantly below the middle band of the Bollinger Bands at around $2,595.40, while the upper band is close to $2,828.
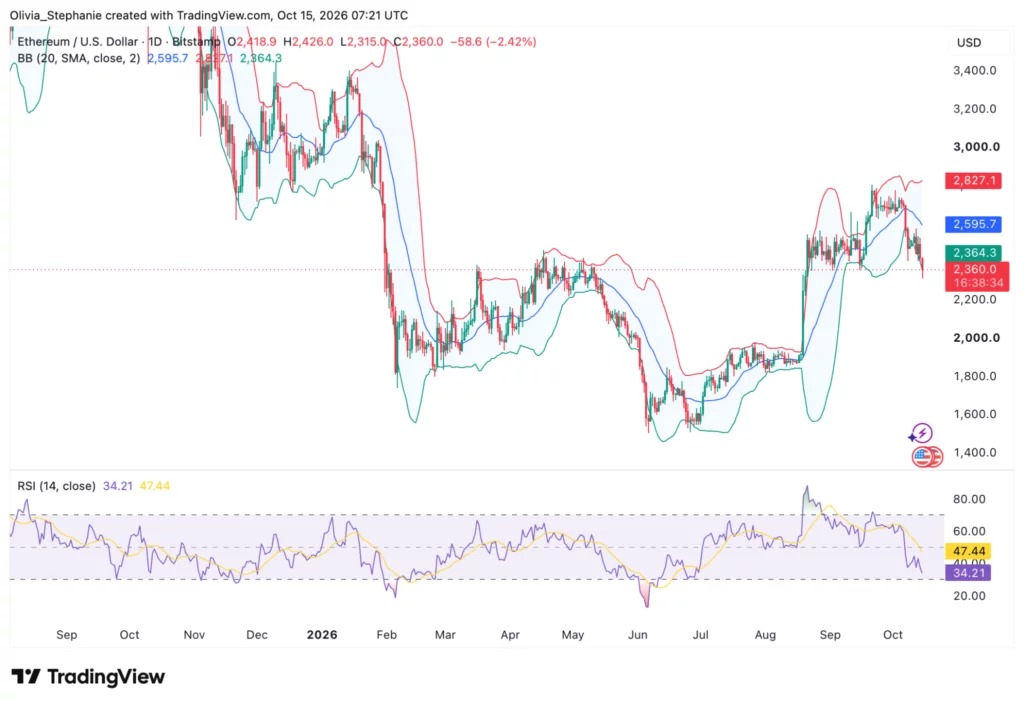
The distances between these bandwidths indicate that there was higher price volatility during the observation period.
The Ethereum Relative Strength Index ( RSI ) is 33.91, which is below the neutral level of 50 and also below its moving average of 47.42.
This reading indicates weak momentum and brings Ethereum close to the commonly watched oversold threshold of 30.
RSI A level below 30 does not guarantee a rebound, and being above that level does not rule out further declines either.
The direct support level indicated in the chart is $2,300. If it continues to fall below this level, it may lead to further selling pressure due to the impact of trading volume and market conditions.
If there is to be a preliminary recovery, traders will pay attention to whether ETH can once again reach the lower band of the Bollinger Bands near $2,363.
If prices further rebound and approach the midline of $2,595, that level will become a higher-level technical reference point.
In a previous analysis of Ethereum prices regarding the outflow of funds related to ETF, traders considered $2,550 and $2,500 as potential downside levels. The decline on October 15th caused Ethereum to fall below both of these regions.
Disclosure: This article does not constitute investment advice. The content and materials on this page are for educational purposes only.