

On October 13th, the price of Bitcoin rebounded to near $84,000. Despite significant selling in the South Korean stock market, weak demand for ETF and a dense volume of sell orders around $84,000 prevented buyers from pushing prices higher.
Bitcoin rebounded to near $84,000 against the backdrop of a significant decline in South Korean tech stocks; over the past week, the KOSPI index has fallen by about 7.4%.
US spot Bitcoin ETF recorded a net outflow of approximately $451 million in October, with a net outflow of $69 million on Monday, indicating that institutional demand remains weak.
CoinGlass data shows that a large number of sell orders have accumulated around $84,000, and Bitcoin has struggled multiple times to maintain its upward trend at this level.
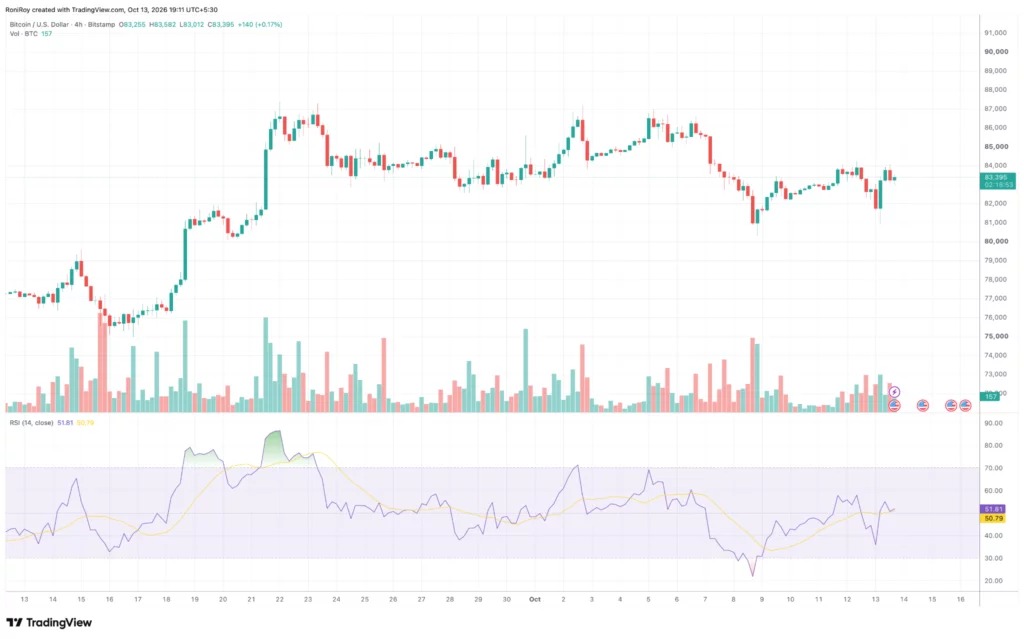
Bitcoin's 4-hour RSI is at 51.81, indicating a slight recovery in buying momentum, while $82,000 remains the recent support level.
According to TradingView data, as of press time, Bitcoin ( BTC ) is trading at around $83,395, having rebounded from a previous low of nearly $81,000 during the session.
This cryptocurrency once approached $84,000, but then gave back some of its gains and is still within the recent trading range of around $80,000 to $87,000.
This rebound occurred as the South Korean stock market once again faced a difficult trading day, with semiconductor companies suffering heavy losses. Despite the selling pressure triggering concerns about investors' risk appetite, Bitcoin managed to recover some of its losses.
However, the declining demand for spot Bitcoin exchange-traded funds in the United States, along with concentrated sell orders around $84,000, continue to limit the room for a rebound.
While South Korea's stock market is declining, the price of Bitcoin remains resilient.
South Korea's KOSPI composite index fell by about 7.4% in the past week, with tech and semiconductor stocks continuing to face pressure.
For the first time since late July, this index has fallen below the 200-day moving average, a technical level commonly used to measure longer-term market trends.
Bitcoin initially faced selling pressure when Asian stock markets weakened, but then rebounded to near $84,000.
In contrast to the market sell-off in August, when tech stocks were weak accompanied by a significant decline in cryptocurrencies.
However, the Federal Reserve's next interest rate decision remains a source of uncertainty.
U.S. consumer inflation data will be released on October 14, followed by the Federal Reserve's policy statement on October 28. Investors currently expect that the Fed will keep borrowing costs unchanged.
The upcoming inflation report may affect this expectation, especially since price pressures remain high.
Bitcoin ETF redemption continues to drag down demand
Since late September, institutional demand has weakened. At that time, US spot Bitcoin ETF attracted approximately $2.39 billion in net inflows in a single week.
Thereafter, the buying momentum of these funds significantly slowed down, and there were multiple trading days in October when funds flowed out.
According to previous reports by crypto.news, as of the week ending October 9th, there was a net outflow of $678.9 million in spot Bitcoin ETF in the United States.
These redemptions are part of a total net outflow of approximately $1.29 billion from crypto investment products tracked in the United States during the same period.
More recently, data cited in market reports on Tuesday indicated that as of October, Bitcoin ETF had seen a net outflow of approximately $451 million, with an additional outflow of $69 million on Monday.
Earlier this month, Bitcoin struggled to maintain a gain above $87,000, at which point the buying interest represented by ETF slowed down near the average holding cost of investors.
On October 5th, in its assessment, Bitfinex noted that US spot Bitcoin ETF investors had only recently returned to near that level after being below their estimated average purchase price for 233 consecutive days.
The institution believes that insufficient spot demand is an obstacle to a sustained rebound, especially when Bitcoin approaches levels at which existing investors can sell without incurring significant losses.
Institutional redemptions then accelerated in the second week of October.
On October 7th, Bitcoin ETF recorded a net redemption of $484.9 million, which is the largest single-day outflow since June.
Sell orders around $84,000 limit Bitcoin's rebound
Exchange order book data for CoinGlass shows that as Bitcoin approached this level on Tuesday, the liquidity of sell orders around $84,000 was increasing.
Sell-side liquidity refers to the sell orders placed above or near the current market price. If there is not enough demand to absorb these orders, a large number of sell orders will make it difficult for buyers to continue to push up the price.
Traders noticed that Bitcoin failed to hold above $84,000 on multiple occasions within a short time frame, despite having recovered from previous declines.
This price level holds significant technical importance throughout October.
Previously, Bitcoin lost support below $84,000 when it fell from above $87,000, and found support around $80,000 during the selling pressure last week.
In a market assessment on October 10th, the $84,400 range was considered an important resistance level before attempting to break through to $87,000 again.
If it can remain above $84,000, $84,500 will come into view, followed by the $85,000 range. If it fails to break through these levels, Bitcoin will face the risk of being tested again at its recent support areas.
Bitcoin price indicators show limited buying momentum
The 4-hour chart of Bitcoin shows that buyers have regained some of the ground lost during the declines on October 8th and 9th, but the cryptocurrency is still below its recent highs.
The Relative Strength Index is 51.81, slightly higher than its moving average of 50.79.
A value slightly above 50 for RSI indicates an improvement in buying momentum after recent sell-offs, but this indicator is still far below the usual 70 level that is considered overbought.
During the previous decline to $81,000, RSI fell below 30, but then rebounded as buyers entered at lower prices.
The price trend also shows a similar situation.
During the rebound period, trading volume increased, but the subsequent candlesticks still showed relatively smaller fluctuations compared to the larger swings during the previous selling phase.
Meanwhile, as of the time of publication, indicators show a slightly bullish outlook, with 10 technical indicators issuing buy signals and 4 issuing bearish signals.
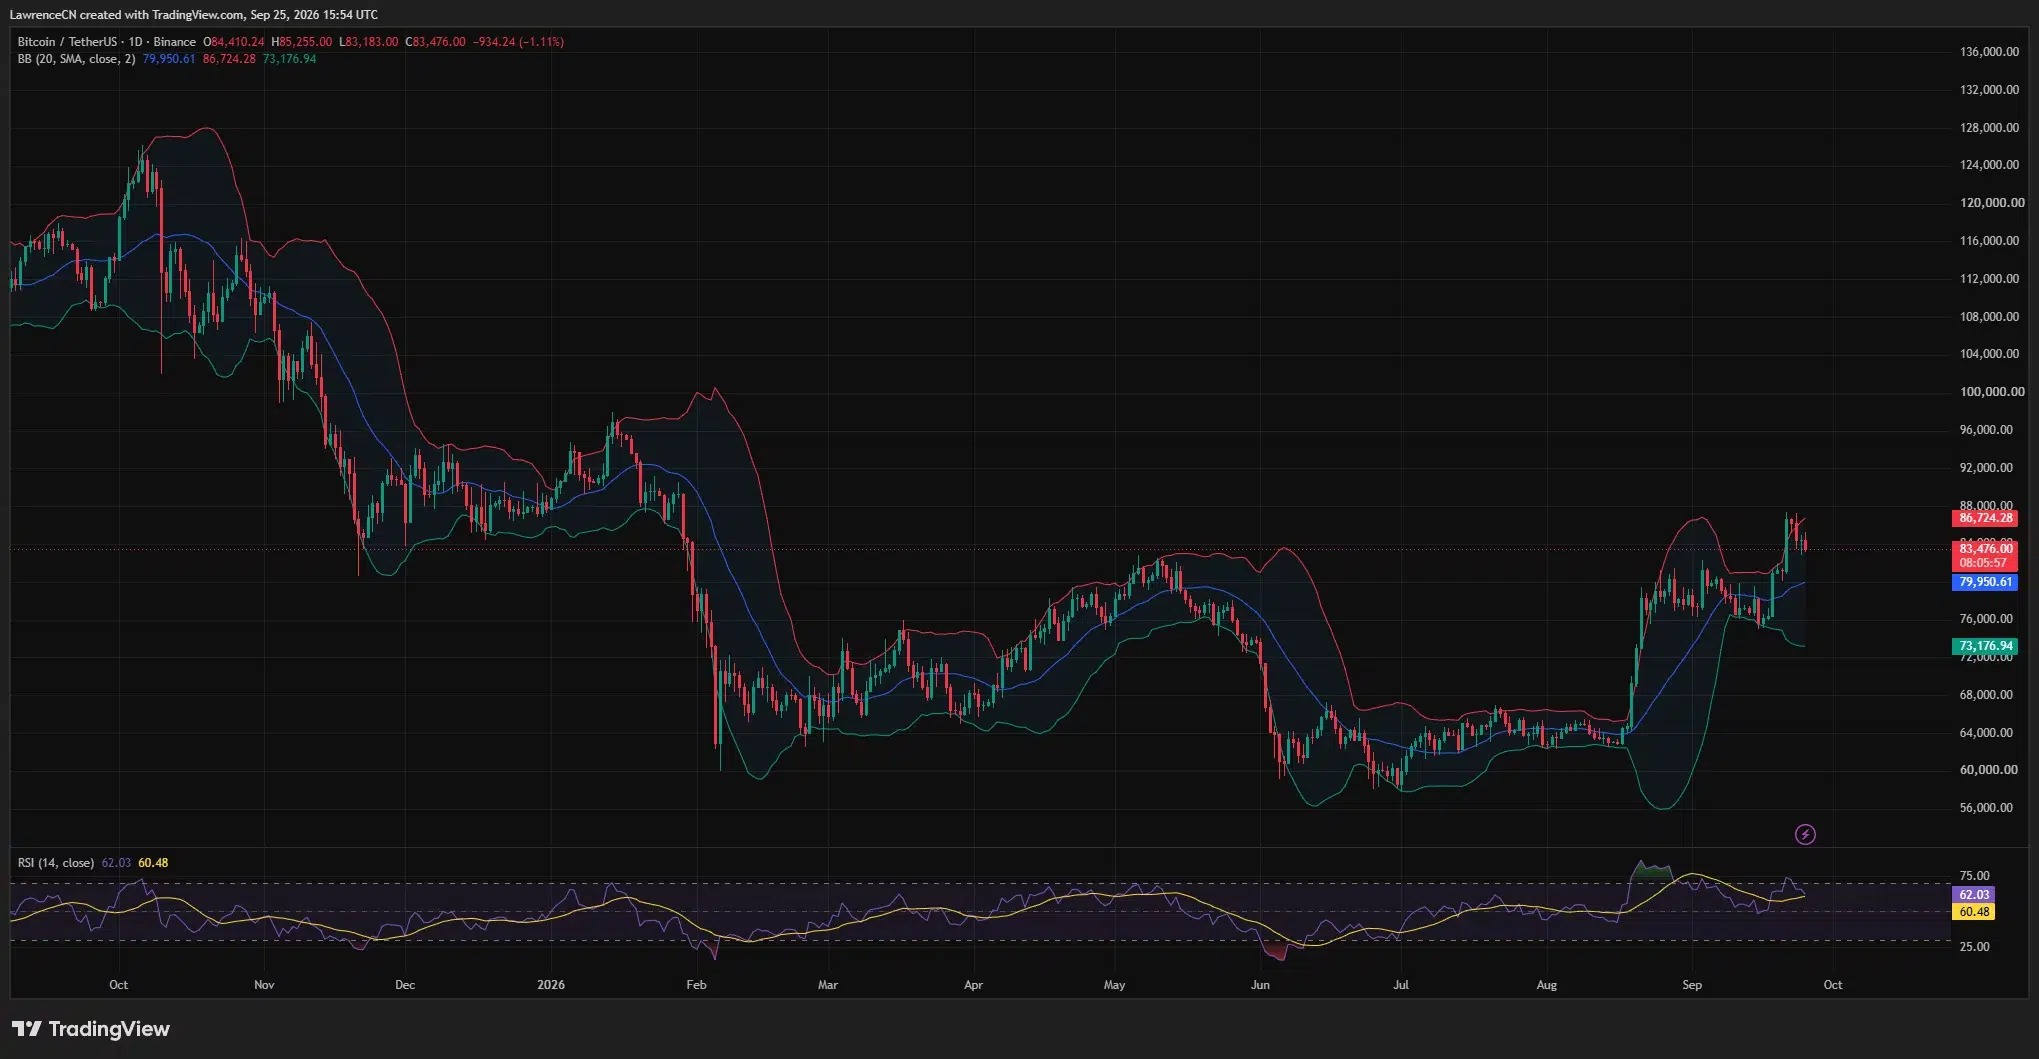
The daily moving average index is still on the bullish side, with the 14-day RSI at a neutral level of 52.42. Indicators suggest that the recent support level is around $82,871, and the next major resistance level is at $87,061, while Bitcoin is still below the middle band of the Bollinger Bands at $83,939.
The immediate resistance level is still between $84,000 and $84,500. If it can continuously break through this range, Bitcoin may challenge $85,000, followed by the previous trading range of $86,000 to $87,000.
On the downside, $82,000 remains the first important support level. If it falls below this level, the recent low of $81,000 will once again come into focus, and a deeper decline could bring the psychological barrier of $80,000 into view.
The release of U.S. inflation data on October 14th remains the next important scheduled economic event. Analysts believe that different inflation outcomes could correspond to price levels such as $80,000 and $86,000.
BTSE Chief Operating Officer Jeff Mei stated that if inflation exceeds expectations, Bitcoin could fall below $80,000; if the data is weaker, it could support a rebound above $86,000.