

After falling last week, the price of Ethereum rebounded to around $2,530, but the resistance level near $2,560 to $2,575 is preventing a further rise and any potential return to $2,700.
Ethereum is trading at around $2,530, below the 20-day and 50-day moving averages on the daily chart.
US spot Ethereum ETF recorded a net outflow of $542.2 million from October 5th to 9th.
Analysts Ted Pillows, Micha, van, de, and Poppe consider the range of $2,560 to $2,575 to be an important recovery zone.
As shown by CoinGlass, there are significant upper clearing concentration areas around $2,585, $2,635 to $2,640, and $2,740.
The Binance ETH / USDT daily chart on TradingView shows that on October 12th, Ethereum traded at $2,529.47, after a significant decline from the $2,700 range earlier this month. During the selling pressure, Ether rebounded from a low of around $2,410, but this rebound was still below both adjacent daily moving averages.
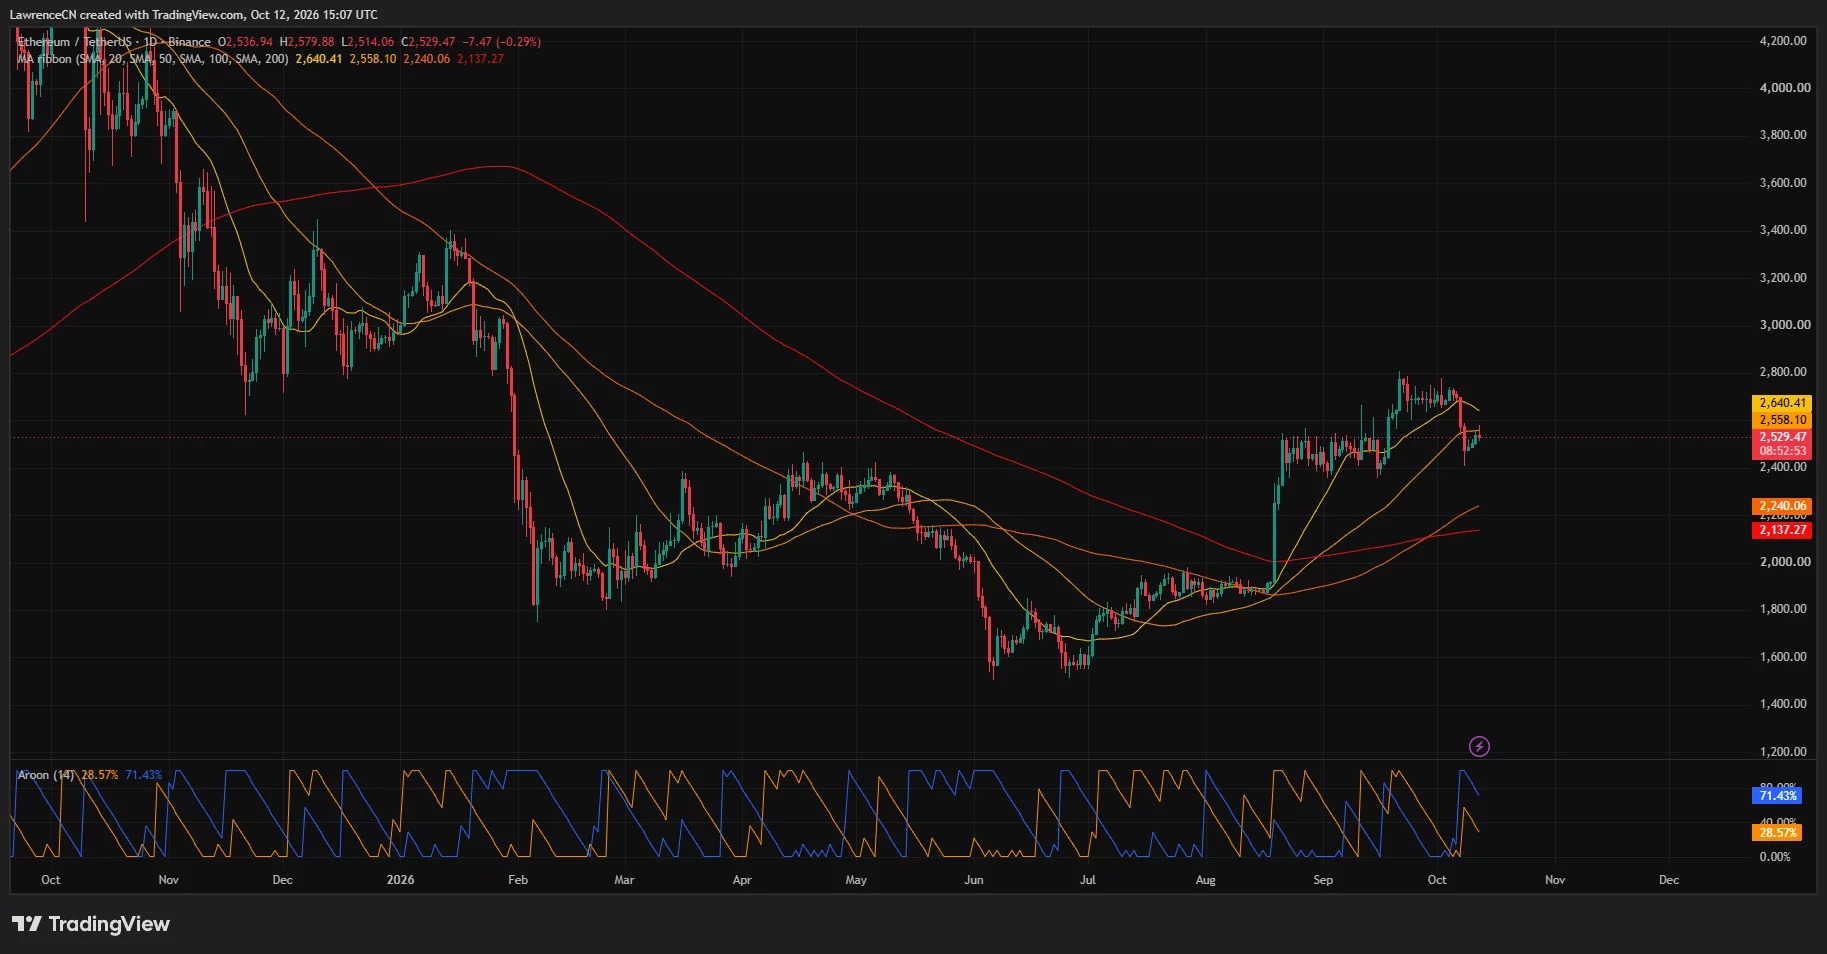
The daily chart shows that the intraday high once reached $2,579.88, after which ETH fell back to around $2,530. This trend briefly pushed Ethereum into the resistance zone identified by analysts, but the price did not manage to stay above that area.
Ethereum faces resistance between $2,558 and $2,640
On the daily chart of TradingView, Ethereum's 50-day simple moving average is at $2,558.10, which is about 1.1% higher than the price shown in the chart. The 20-day moving average is even higher, at $2,640.41, forming a second technical barrier above the current resistance zone.
The daily chart also shows that Ethereum’s price is above the 100-day moving average of $2,240.06 and the 200-day moving average of $2,137.27. These longer-term moving averages are significantly lower than the recent trading range, which indicates that the areas of $2,500 and $2,400 should be the primary targets of attention below.
Aroon indicators show that the downward line is at 71.43%, and the upward line is at 28.57%. The higher downward reading reflects that during the period of this indicator's backtracking, the impact of recent lows was more prominent, despite Ethereum having rebounded from last week's trough.
To continue with the upward trend, the daily chart shows that the first moving average resistance is around $2,558, followed by $2,640. Further above that, the recent trading range is around $2,700, and the high point in September is close to $2,800, which still serve as reference levels above.
Lacked momentum below $2,560 after a 4-hour rebound
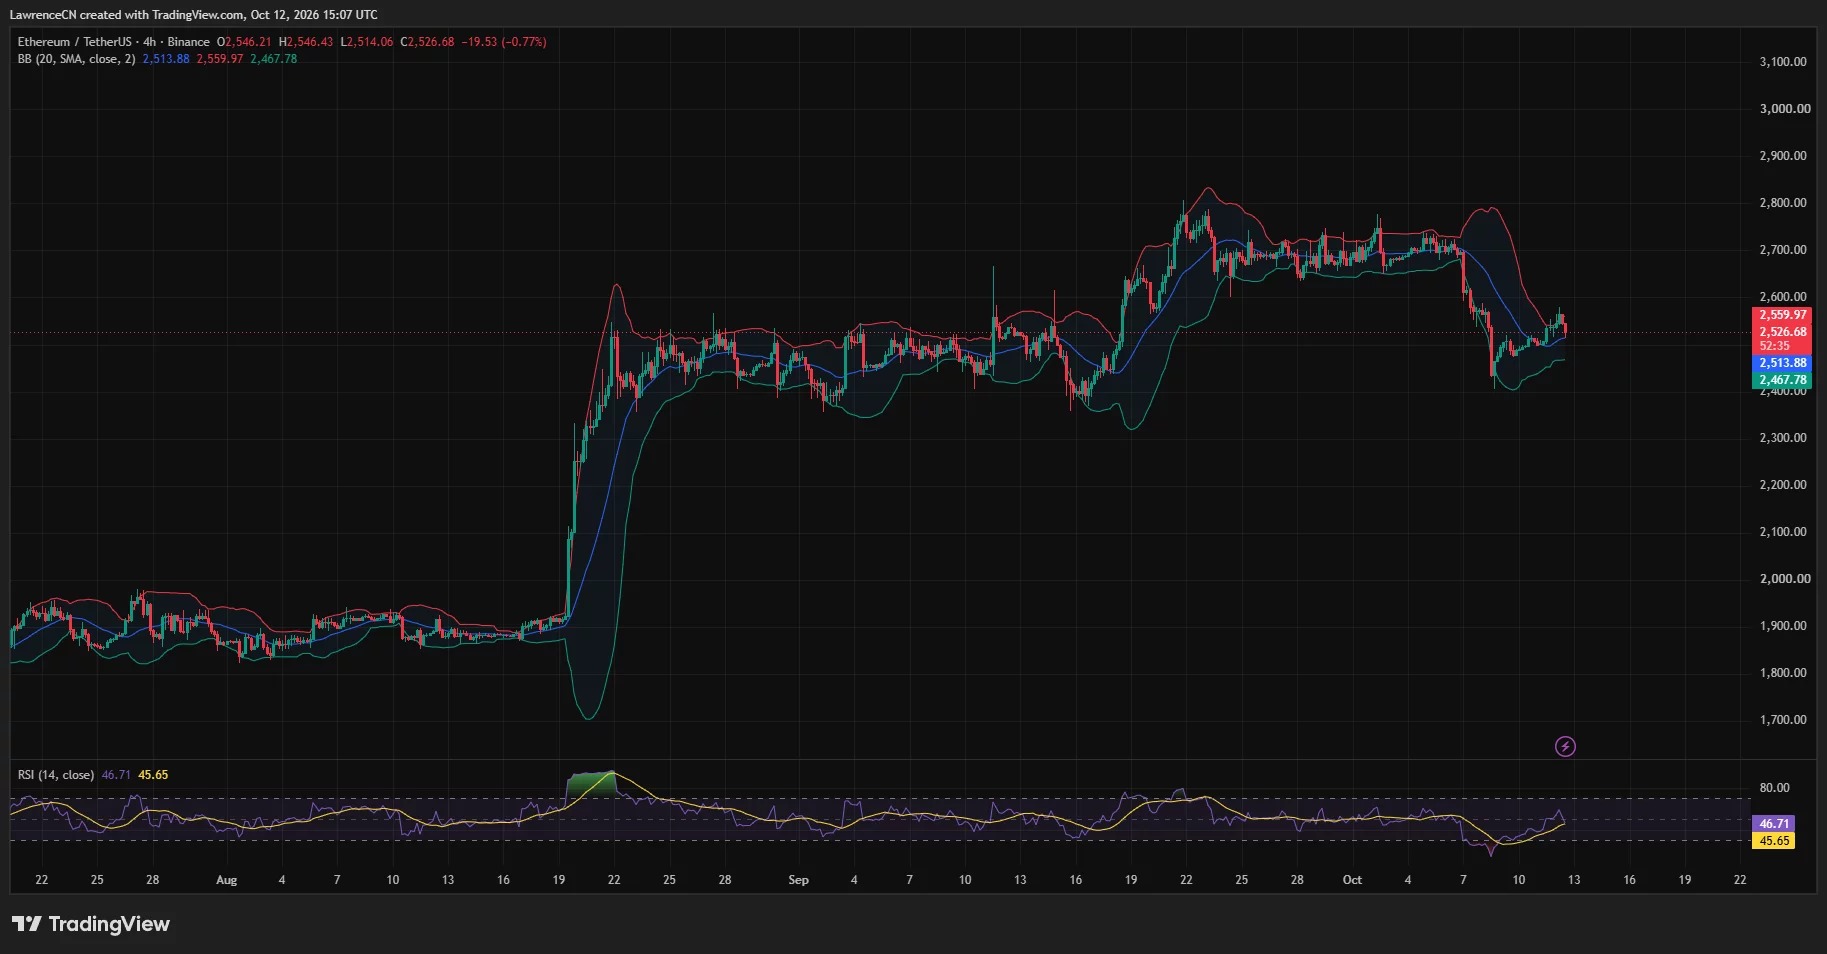
The 4-hour chart of TradingView shows that ETH is trading at $2,526.68, above the middle band of the Bollinger Bands at $2,513.88. The upper band is at $2,559.97, and the lower band is at $2,467.78.
The upper Bollinger Band is very close to the 50-day moving average on the daily chart, which means that the range of $2,558 to $2,560 corresponds to two different technical indicators at the same time. Ethereum's rebound once approached this area before falling back near the middle band of the Bollinger Bands.
The 4-hour Relative Strength Index is 46.71, with a smooth average of 45.65. RSI has rebounded from the oversold area reached during the selling period, but it is still below the neutral 50 level.
The price trend on the same chart shows that Ethereum rebounded from around $2,410, consolidated in the range of $2,480 to $2,510, and then rose to around $2,570. Subsequent declines kept ETH above the middle band of the Bollinger Bands, but below the upper band.
Therefore, the recent reference levels are $2,514 and the psychological barrier of $2,500, followed by the lower support at around $2,468. If there is further decline, the recent lows of around $2,410 and the $2,400 area will once again become focal points.
Analysts have set the recovery threshold at around $2,575.
Analyst Ted Pillows pointed out in a post on October 12th that $2,560 to $2,570 is Ethereum's current resistance range. He stated that if this range can be regained, it could open the way for a rebound to $2,700.
His judgment was made after the price broke above $2,550 earlier on. Subsequently, the TradingView reading showed that Ethereum fell back to around $2,530, indicating that after testing higher levels, the price had once again fallen below that level.
Micha ël van de Poppe set a slightly higher threshold in their post on October 11th, stating that they hoped to see the price strongly break through $2,575. They mentioned that Ethereum is still below an important resistance level and that more strong performance is needed.
van de Poppe also indicates that he expects Ethereum to outperform Bitcoin in the coming period. His view is still a prediction, and a stronger ETH breakthrough is one of the confirmation signals he hopes to see.
Overall, the immediate recovery test range suggested by both analysts is between $2,560 and $2,575. The $2,700 scenario proposed by Ted Pillows depends on Ethereum regaining its resistance levels, but the latest chart readings indicate that this test has not yet been completed.
ETF Capital outflows coexist with the aforementioned settlement period.
Farside Investors data shows that from October 5th to 9th, there was a net outflow of $542.2 million in US spot Ethereum ETF. Daily data also indicates that there was a net outflow for 9 consecutive trading days from September 29th to October 9th, totaling $697.4 million.
The largest single-day outflow last week occurred on October 6th, with a net outflow of $201.9 million, all coming from ETHA of BlackRock. Farside reported that another outflow of $160.9 million took place on October 7th, followed by an outflow of $72.5 million on October 8th and $56.1 million on October 9th.
The closest range among these is above the resistance zone of $2,560 to $2,575 indicated by the analysts. The concentrated area near $2,640 also closely coincides with Ethereum's 20-day moving average on a daily chart.
Below the market, CoinGlass indicates that there are clearing zones around $2,480, $2,450 to $2,470, and $2,400. Ethereum's recent low point has touched the lower edge of this structure, followed by a rebound.
Currently, Ethereum is trading between a near-term support level of around $2,500 and a resistance range of $2,560 to $2,575. The daily moving average, the 4-hour Bollinger Bands, and the thresholds suggested by analysts all place the first hurdle for a rebound within a narrow range not far from the current price.
Disclosure: This article does not constitute investment advice. The content and materials on this page are for educational purposes only.