

Around the opening of U.S. stocks on Thursday, yields on U.S. Treasury bonds tumbled significantly, while the price of Bitcoin tried to maintain a local upward trend with "higher highs and lower lows."
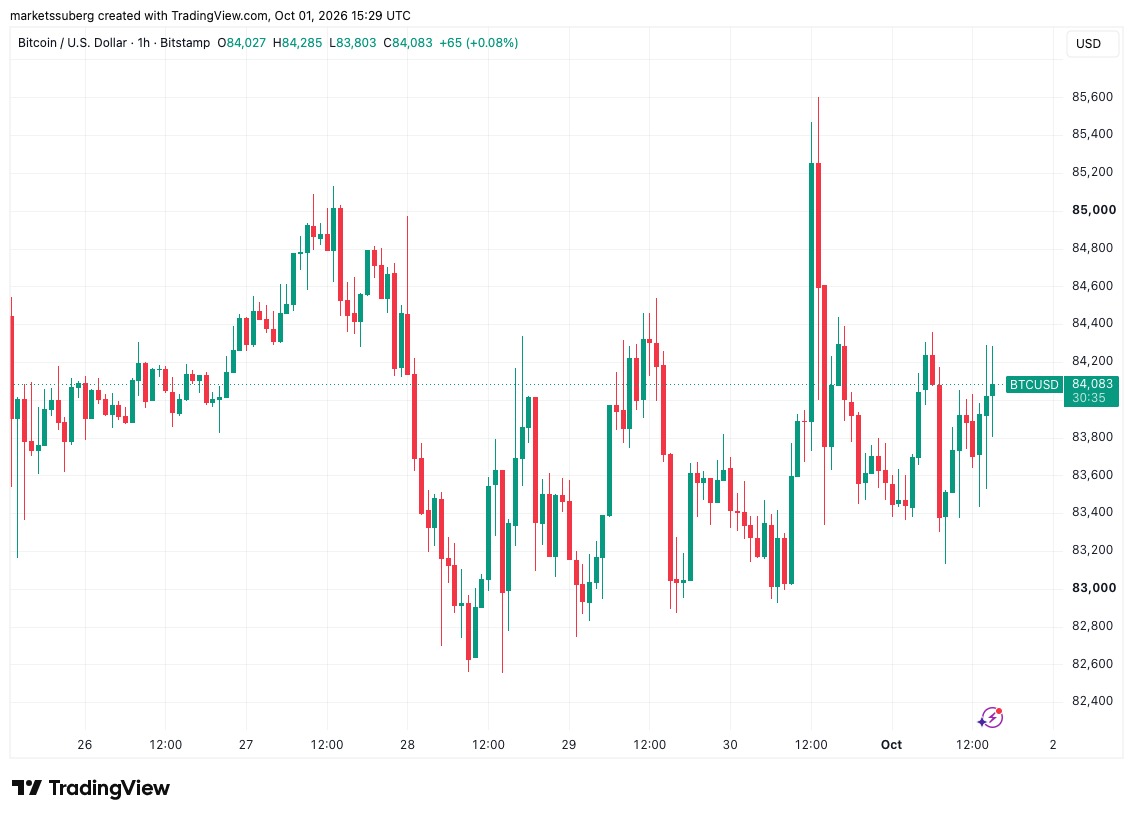
Bitcoin ( BTC ) briefly broke through $84,000 during the opening hours of U.S. stocks on Thursday, as the yield on U.S. Treasury bonds fell after reaching multi-decade highs.
Key points:
- BTC attempted to consolidate higher lows during the first US trading session in October, with $84,000 becoming a focal point of attention.
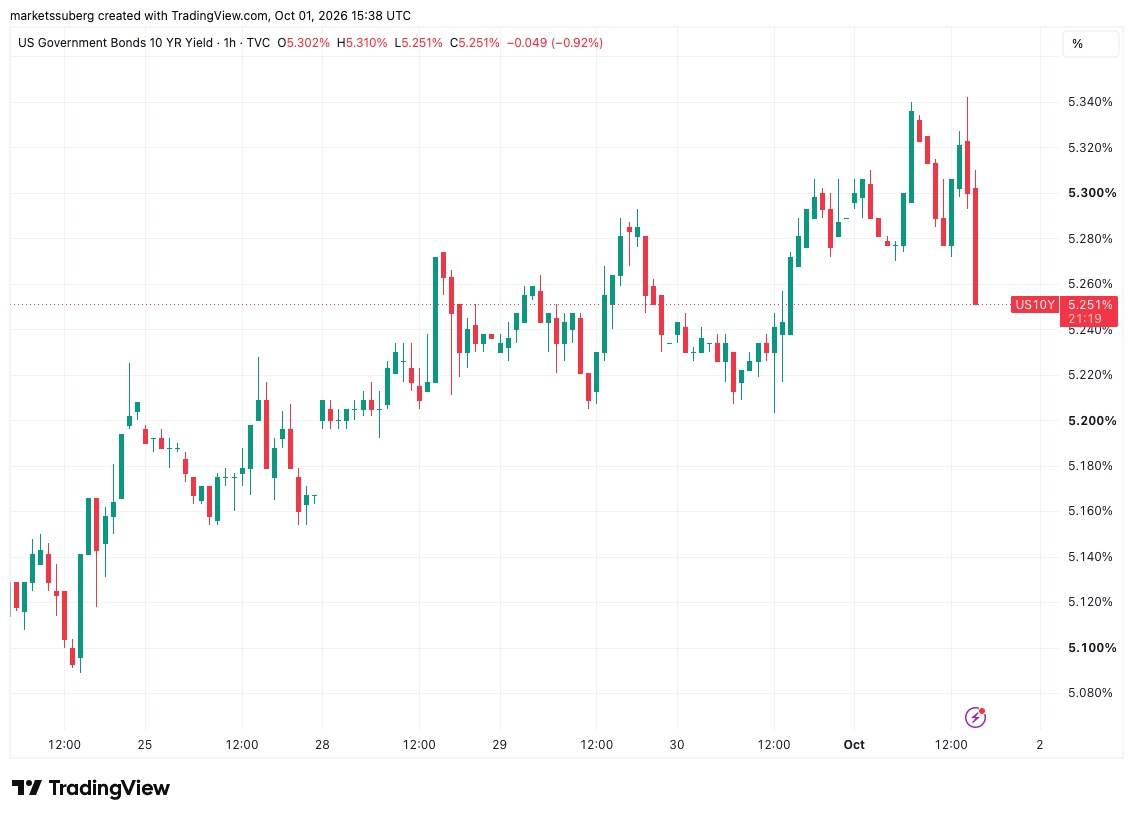
- U.S. 10-year Treasury yields touched a high of 5.342% since April 2002 before falling at the opening of U.S. stocks.
- According to Rekt Capital, Bitcoin could retest at $82,500 in a "chaotic" manner.
U.S. Treasury yields fell after hitting a new macroeconomic high
TradingView data shows that BTC / USD maintained a higher-high and lower-low pattern on the hourly level, with a daily increase of 0.6%.
BTC / USD 1-hour chart. Source: Cointelegraph / TradingView
U.S. 30-year and 10-year Treasury yields both hit new macro highs, with the 10-year yield briefly rising to 5.342%, a level not seen since April 2002, before falling back to 5.251% at the time of this article's writing.
US 10- year bond yield one-hour chart . Source: Cointelegraph / TradingView
Speaking about the forces behind the continuous selling in the bond market, Mahmood Pradhan, former Deputy Director of the European Department of the International Monetary Fund, told The New York Times that global markets are "very nervous" about the rising public debt, and the increase in yields will raise the interest costs for governments around the world.
He said, "The wars in the Middle East have indeed changed everything," and the higher oil prices are already reflected in the inflation data.
As previously reported by Cointelegraph, the U.S. personal consumption expenditure ( PCE ) index in August – a preferred inflation indicator for the Federal Reserve – showed a year-on-year increase of 3.4%, which was lower than expected. However, the market reacted little to this weaker reading. Analysts believe that changes in the calculation method of PCE largely explain this decline.
Cryptography analyst Benjamin Cowen said to followers of Platform X, "Since the market began to worry that the Federal Reserve is no longer taking inflation seriously, yields have risen rapidly." He added:
"Well, the bond market has already 'rebelled,' and this situation is likely to continue until the Federal Reserve truly brings inflation under control."
Analysis: A backtest of Bitcoin's support level "could be quite chaotic"
Bitcoin is traded between the increasing liquidity above and below the spot price in the exchange order book. CoinGlass data shows that as of the time of writing, $84,500 and $82,900 are key areas of concern, both of which could become attractive levels for prices.
Within the past 24 hours, the total settlement amount reached 25 million US dollars. The long and short positions in the vicinity helped to maintain a range-bound fluctuation in the market.
BTC Clearing Heat Map. Source: CoinGlass
After evaluating the current market structure, trader and analyst Rekt Capital expects prices to fall back to the key support level of around $82,500 again.
He wrote on X: “If the backtesting is successful there, it might prepare us for the continuation of the next trend. History shows that this backtesting could be quite chaotic, but let’s take it one step at a time and not look too far ahead.”
Previously, Rekt Capital stated that whether the bulls can hold the $82,500 support level will determine a larger-scale rebound for Bitcoin.
BTC / USD 1-month chart. Source: Rekt Capital on X.com