Alphabet's stock price is consolidating around $340, with EU fines and AI backlogged orders creating a tug-of-war situation.
Alphabet closed at $340.92, down 0.53%, below the 20-day moving average of $343.63 and the 50-day moving average of $345.74. However, the daily price is still above the 200-day moving average of $327.63, so the longer-term upward trend remains intact.
This is not a clear bearish pattern, but rather a pullback within an upward trend. The price is at $340.92, and the short-term momentum is weakening, but there has yet to be any structural breakdown.
The momentum indicator shows indecision.

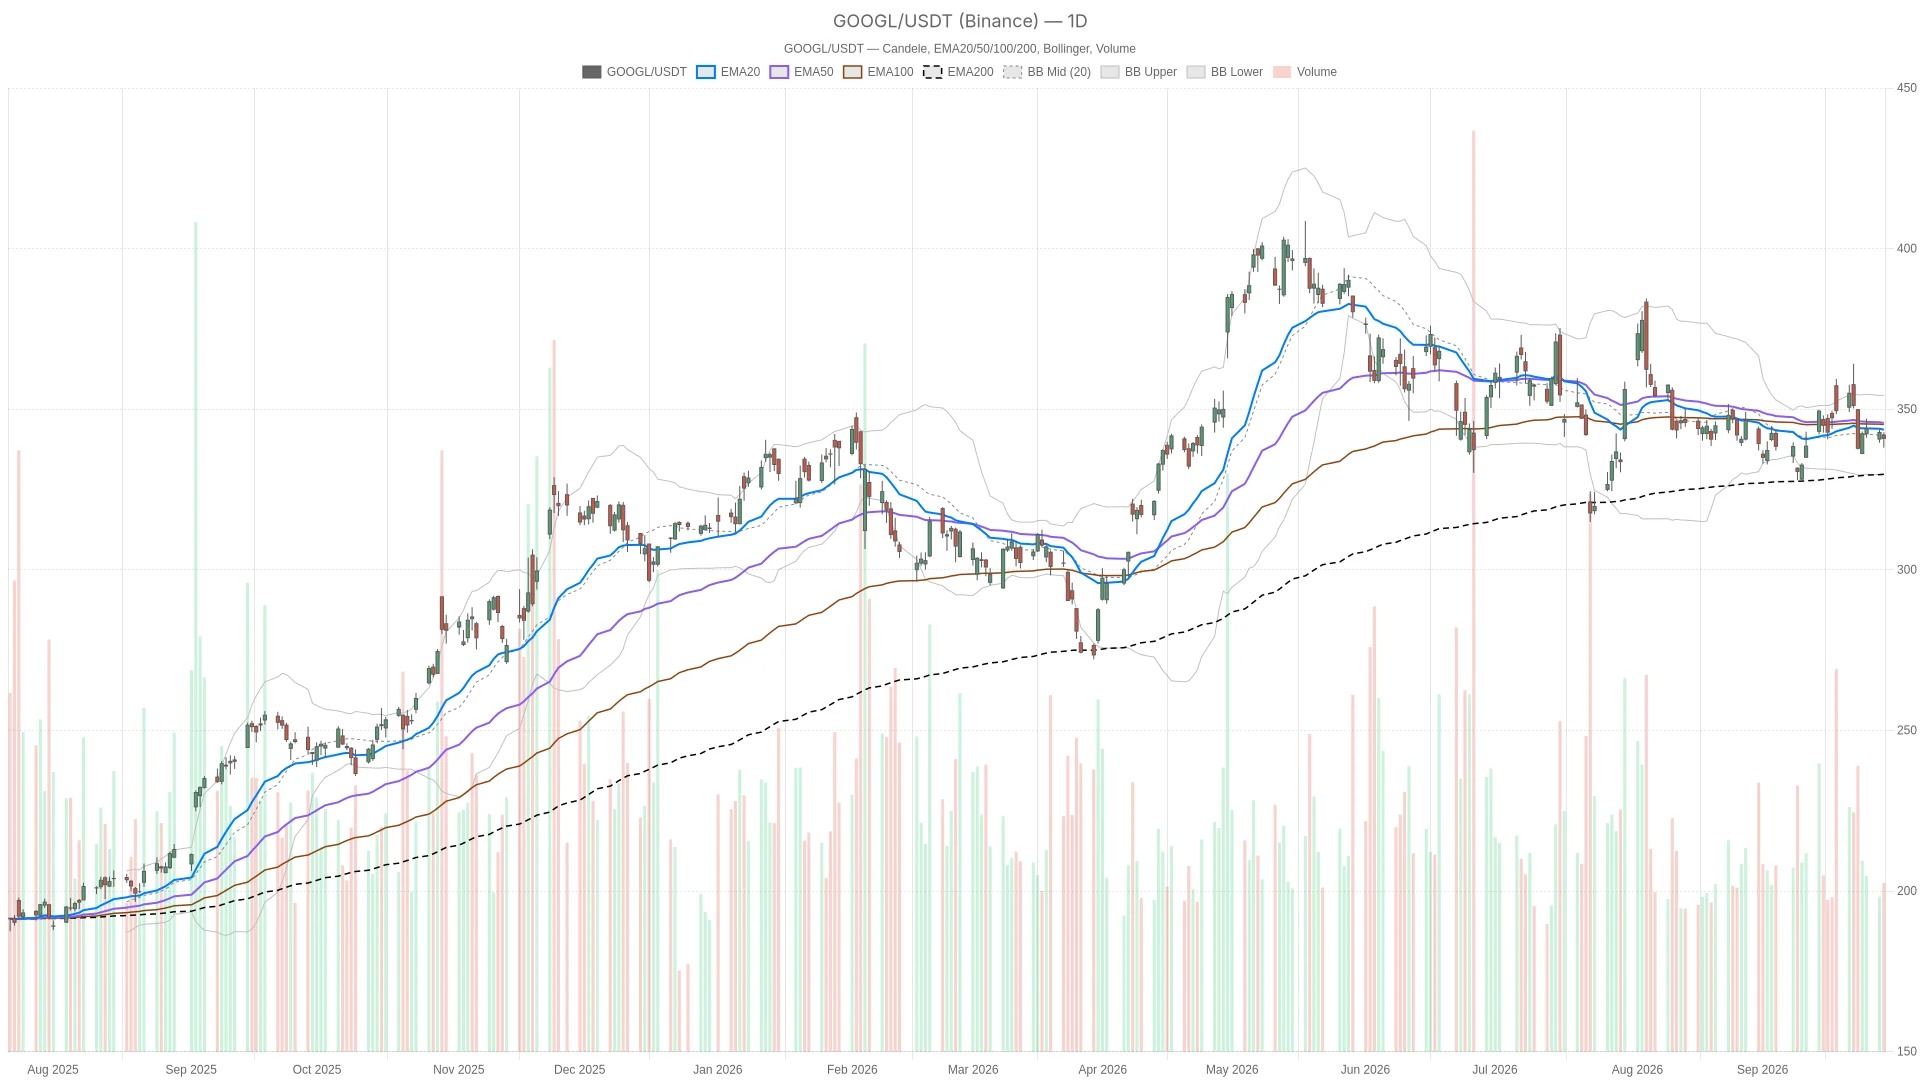
The daily line RSI14 is at 47.36, which is almost exactly at the median, reflecting hesitation rather than one-sided pressure. The daily line MACD shows a similar situation: the MACD line is at -0.29, slightly below the signal line of -0.30, and the bar chart only shows a difference of 0.01.
This is almost the closest state to a flat momentum, indicating that the recent weak trend is losing its strength, rather than accelerating further.
Bollinger Bands and Pivot Points define the range
The daily Bollinger Bands structure also reinforces a neutral outlook. The price of $340.92 is close to the middle band of $342.06 and is firmly within the range of $329.79 to $354.33. There are no signs of contraction or expansion, indicating that volatility is not about to change significantly. The daily ATR14 value is 8.21, suggesting that current volatility is still moderate, not intense.
It is worth noting that the pivot point clearly delineates the short-term battle zone. The daily pivot point is at $340.59, which almost coincides with the closing price. The resistance above is at $343.17, and the support below is at $338.35. In fact, the closing price on Tuesday fell exactly on the dividing line between bulls and bears.
The weakening on the hourly chart makes the situation more complex.
The hourly chart shows a clear bearish pattern, with prices below all three major moving averages. The daily chart indicates fatigue, while the hourly chart reflects a genuine weakening in momentum.
Over a 1-hour period, the price of $340.94 is lower than the 20-hour EMA of $341.32, which in turn is lower than the 50-hour EMA of $343.10. The 50-hour EMA is further below the 200-hour EMA of $345.25. This constitutes a completely bearish setup. The RSI14 reading is 46.18, which is also in line with this weak trend. Meanwhile, the MACD is at -1.07, below the signal line of -1.18, and the momentum indicator remains negative.
However, the bar chart has rebounded to 0.10. This is a small but noteworthy sign that indicates that the downward pressure may be weakening rather than continuing to accumulate. The hourly pivot point is at $341.18, resistance is at $341.80, and support is at $340.31. The price is hovering right on the pivot point, which is also a signal that the market is still looking for a direction and has not yet made a clear choice.
Therefore, the conflicts between different time frames deserve a direct explanation. The daily chart supports an upward trend that is still in good shape despite showing signs of fatigue, and it is currently digesting regular pullbacks; however, the hourly chart indicates that the short-term trend is weakening, with prices below all major moving averages. These two views do not negate each other but rather describe a stock that has entered a short-term correction phase. Nothing structurally important has been damaged yet.
The rebound in the 15-minute chart brings limited relief.
On the 15-minute chart, the situation is slightly more positive. This mainly affects the timing of execution rather than a broader trend. The price of $340.94 is higher than the 20-period EMA of $340.15 and the 50-period EMA of $340.64, but it is still lower than the 200-period EMA of $343.74.
At the same time, RSI14 is at 56.72, which is slightly bullish. MACD has turned positive, and MACD is at 0.09, which is higher than the signal line of -0.21; the bar chart shows 0.30, indicating a short-term bullish crossover. The price is also approaching the upper band of 341.33 dollars, while the middle band is at 339.61 dollars. This suggests that there is interest in buying during the session near the lower levels.
In short, the 15-minute trend shows a small rebound attempt within a broader hourly downtrend. It is helpful for determining the entry point, but it is not sufficient to overturn judgments based on higher time frames.
The news stream brings two opposing forces: regulation and AI.
There is a divergence in sentiment among the news. Regulatory pressures from the European Union are offsetting the optimistic sentiment surrounding the backlogged orders related to Google Cloud. According to reports from Yahoo Finance, the stock price of Alphabet has fallen due to Google filing an appeal against the EU's AI access order. This media outlet describes the lawsuit as a defense of platform control rights, but it also prolongs the uncertainty for competitors regarding access to Android and search data.
In addition to this regulatory pressure, another report by Yahoo Finance earlier this week mentioned a fine of 403 million euros. The media believes that Google Cloud is still promoting a broader narrative. Meanwhile, an article published by Seeking Alpha the day before suggested that investors should buy Alphabet before TPU realizes its value. The article pointed out that accelerated growth of Google Cloud, increased adoption rates of Gemini, and a backlog of orders totaling 51.4 billion dollars are all strong indications of AI's potential to drive revenue visibility.
In contrast, another article published after the close on Tuesday, Seeking Alpha, expressed a more cautious view on valuation. The article pointed out that although Alphabet is indeed building a genuine AI business, the current price may indicate that investors are paying a premium. This article is more relevant to the next trading day rather than explaining the trends of Tuesday. Investing.com also mentioned that Alphabet A was contracting around the Fibonacci support level of around $341.65 earlier this week, which is quite close to the current consolidation range.
Alphabet Stock Price Bull-Bear Scenarios
In a bullish scenario, the stock price is required to rise back above the 20-day moving average of around $343.63. In a bearish scenario, it depends on whether the price falls below the daily pivot point of $340.59.
Specifically, for a bullish scenario, the daily MACD bar chart needs to continue to expand in the positive direction, rather than just staying flat. It would be helpful if it can once again break above the daily pivot resistance of $343.17; at the same time, the hourly chart also needs to reverse the alignment of moving averages, with prices first recovering to $341.32 and then to $343.10. Only then can we reasonably conclude that the 'pullback has ended.' The bullish narrative surrounding the accumulated orders around Google Cloud and the realization of TPU through AI will provide a fundamental backdrop, but such a trend still requires price confirmation and cannot rely solely on news headlines.
On the other hand, if the price fails to hold above the daily pivot of $340.59, the bearish scenario will strengthen. A further decline to the support level of $338.35 would be concerning. If the hourly chart moving averages remain below $345.25, such a break would be even more significant. If the daily MACD bar chart turns negative again, it would also undermine the argument that "selling pressure has been exhausted." Ongoing regulatory frictions within the EU could also add to the valuation concerns mentioned in the post-market commentary. If technical support is breached, these factors combined could continue to attract selling pressure.
Outlook
Alphabet The stock price is still in a consolidation phase, with the pivot area around $340 to $341 being a key decision point. The stock is caught between contradictory signals: the daily chart appears weak but has not broken its structure, the hourly chart is clearly bearish, and the rebound on the 15-minute chart is only a temporary relief.
Currently, the volatility is still under control. The daily ATR14 level is at 8.21, indicating that the market has not yet factored in significant fluctuations. Patience is required when arranging positions around the current price level. The pivot area around $340 to $341 is indeed playing a decisive role. Uncertainty is likely to continue for the next few trading days until one time frame clearly prevails over another.
Frequently Asked Questions
What is the outlook for the stock price of Alphabet after the close on Tuesday?
Alphabet closed at $340.92, down 0.53%, below both the 20-day and 50-day moving averages, but still above the 200-day moving average. This has created a consolidation pattern, with conflicting signals from different time frames, and there is no clear directional bias for the next trading day.What are the key support and resistance levels for the stock price of Alphabet?
The daily pivot point of $340.59 is the current decision-making level, with support at $338.35 and resistance at $343.17. On the hourly chart, the resistance is at $341.80 and the support is at $340.31.What are the fundamental factors currently affecting the stock price of Alphabet?
Regulatory pressure from the EU regarding AI access commands, as well as a fine of 403 million euros, constitute a drag. On the positive side, there are backlogged orders worth 514 billion US dollars, accelerated growth of Google Cloud, and the potential for TPU to be realized, all of which support the investment narrative driven by AI.Is the long-term upward trend of Alphabet still there?
Yes. Although the stock price has fallen below the short-term moving average, Alphabet is still significantly above the 200-day moving average of $327.63. The daily chart depicts a regular pullback within an upward trend, rather than a structural break.This article is for informational purposes only and does not constitute financial advice, investment recommendations, or an offer to buy or sell any financial instruments or cryptocurrencies. The analysis provided in this text does not represent future results. Investing in crypto assets and financial markets carries a high risk of principal loss. Before making any decisions, please conduct your own research and consult with a qualified financial advisor.
This article was generated with the assistance of artificial intelligence and has been reviewed by an editorial team.