


According to CoinMeta data, Ethereum's price rebounded to $2,800, climbing from a 24-hour low of $2,608 to $2,807, representing a gain of approximately 5.46%. Can this rebound be sustained? And can it hold $3,200 before the end of the month? As of press time, Ethereum is trading at $2,740. This article breaks down the key variables affecting Ethereum's price direction from three dimensions: the drivers of the rebound, the conditions required to hold $3,200, and the future price outlook.
Table: Overview of Key Ethereum Price Data
| Data Item | Value / Status |
|---|---|
| ETH Spot Price | 2802.69 USDT |
| ETH Spot ETF Single-Day Net Inflow | $270 Million |
| BlackRock ETHA Single-Day Net Inflow | $110 Million |
| ETHA Historical Total Net Inflow | $13.067 Billion |
| ETH Spot ETF Total Net Asset Value | $17.817 Billion |
| Bitmine Total ETH Holdings | 5.98394 Million |
| Whale Address Holdings Percentage | 22.03% of Circulating Supply, |
| ETH Options Put/Call Ratio | 0.49 |
| Fed Federal Funds Rate | 3.75%–4.00% |
| 10-Year US Treasury Yield | ~5% |
| ETH/BTC Exchange Rate | ~0.032 |
Note: The above content is compiled and summarized by CoinMeta based on public market data. Please refer to actual data if there are any discrepancies.
Three Drivers Behind Ethereum's Rebound to $2,800
After Ethereum rebounded to $2,800, what is supporting the upward trend? Let's break it down from three aspects: spot buying, whale position rotation, and options sentiment.
Spot Buying Returns
In our view, Ethereum's rebound to $2,800 this time was not driven by forced leverage in futures, but by real capital buying.
According to data from CoinMeta, Bitmine's announcement on September 21 showed that the company purchased another 27,562 ETH during the week of September 14-18, worth approximately $75 million. It now holds 5.98394 million ETH, accounting for 4.9% of the circulating supply, just 2% away from its 5% target. The ETH spot ETF also saw net inflows of $270 million on September 21 (US Eastern Time), with BlackRock's ETHA contributing $110 million alone, bringing its cumulative net inflows to $13.067 billion. In contrast, the BTC ETF saw cumulative net outflows of approximately $462.7 million from September 8-11, ending a three-week trend of capital inflows.
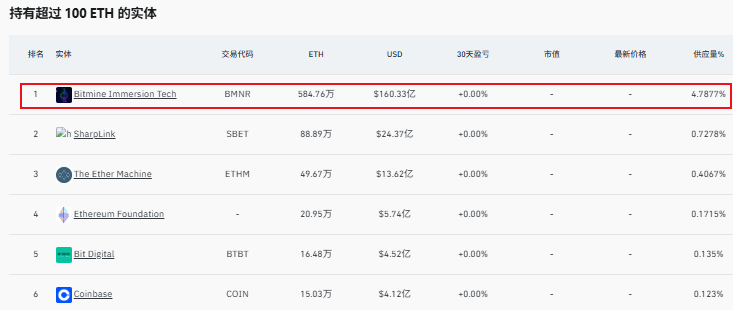
Image: Bitmine ETH Holdings
Whales Sell BTC for ETH
An on-chain action is worth noting. Lookonchain spotted a wallet that sold approximately 1,100 BTC, then swapped about $87 million into ETH and staked it all. You can understand this as: not just buying, but also locking up the chips. This play of "sell BTC, buy ETH, then stake" reduces the circulating supply while expressing a long-term bullish attitude. In our view, whales voting with their feet is more convincing than just talking bullish.
Options Sentiment Turns Bullish
The options market is also quietly shifting. Ethereum call option open interest has exceeded put option open interest by more than double, and the put/call ratio dropped from a bearish position last week to 0.49. You may not usually pay attention to this number, but it indicates that derivatives players are betting on the upside. In our view, this is the most easily overlooked yet important signal in this rebound.
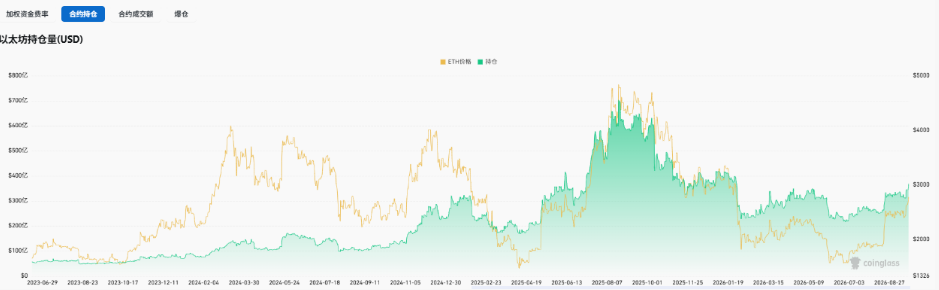
Image: Ethereum Contract Positions
Regarding Ethereum's latest price rebound to $2,800, our view is that this round is different from previous ones. Current open interest is approximately $14.5 billion, far below the yearly high, indicating that it is not driven by forced leverage, but rather spot market slowly accumulating. This type of rally is usually more stable and resilient than a market pulled up by futures contracts.
What Does It Take for Ethereum to Hold $3,200 by Month-End?
After understanding the momentum behind Ethereum's latest price rebound to $2,800, can it hold $3,200? In our view, the supply wall, ETH/BTC exchange rate, and macro interest rates are three mandatory questions to answer.
The $2,700 to $2,800 Supply Wall
On-chain data platform URPD shows that over 13 million ETH were previously traded in the $2,700 to $2,800 range, accounting for over 10% of the circulating supply, forming a significant "supply wall." Analyst alicharts also pointed out that the holding costs of this batch of chips are highly concentrated, making it a key range that whales must break through, otherwise Ethereum cannot reach $3,000.
In our view, the first test for $3,200 is not a technical indicator, but the patience of the holders of these 13 million ETH.
Can ETH Outperform BTC? That is the Key
Looking at the USD price alone is not enough; we need to look at ETH's performance against BTC. According to CoinMeta market data, as of September 18, 2026, ETH/USDT was at $2,494, while BTC was trading at approximately $77,900. ETH's gain was only about half of BTC's. The ETH/BTC exchange rate continues to fluctuate in the 0.031-0.032 range, and a double-top pattern is showing signs of forming on the technical chart.
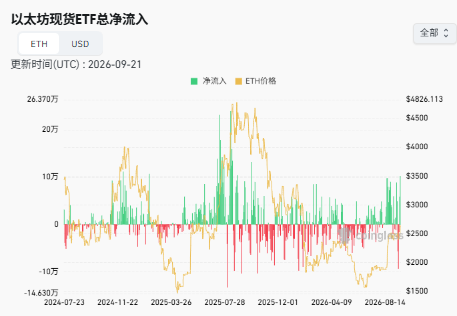
Image: Ethereum ETF Overview
Additionally, ETF fund flows also illustrate the problem: the Ethereum spot ETF had net outflows for three consecutive days as of September 17, with a single-day net outflow of $39.24 million, while the BTC ETF turned to net inflows during the same period. In our view, the Ethereum spot ETF's current total net asset value is approximately $15.4 billion, accounting for only 5.15% of Ethereum's total market cap. This scale is not enough to continuously catch up with BTC in marginal pricing, and $3,200 lacks sustained capital support.
Fed High Rates Pressure Risk Assets
The pressure from the macro environment is also unavoidable. In the early hours of September 17 (Beijing Time), the Federal Reserve's FOMC unanimously approved a 25 basis point rate hike with a 12-0 vote, raising the target rate range to 3.75%-4.00%. At the same time, the 10-year US Treasury yield was at 4.83%, and the 30-year was at 5.28%, both at the 99th percentile or above since 2010. The 10-year real yield was as high as 2.46%, also at the 99.8th percentile.
In our view, in an environment where the risk-free rate is close to 5%, the opportunity cost of holding ETH has significantly increased, and capital naturally favors safer assets.
Ethereum Future Price Outlook
According to CoinMeta real-time Ethereum data, technically, ETH's RSI reading is 67.17, approaching the overbought threshold of 70 but not yet touching it. The MACD histogram is near the zero axis, and the direction selection has not been completed. ETH options max pain is at $2,500, indicating that the breakeven point for most options positions is concentrated in this area.
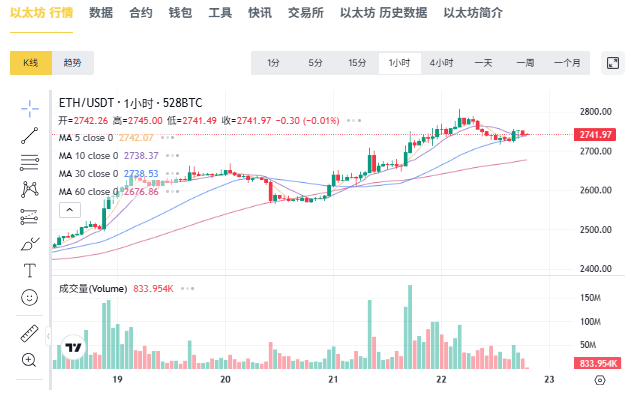
Image: Ethereum Real-time Candlestick Chart
In the short term, the $2,500-$2,600 range is key support for ETH. If this range is maintained, $2,800 will gradually turn into new support, and a test towards $3,000-$3,200 will follow. In the medium term, the sustainability of spot ETF inflows and the Fed's subsequent policy path will be the two major variables determining whether ETH can hold $3,200.
FAQ
Q1: Does continuous net inflow into Ethereum ETFs mean the price will definitely rise?
Not necessarily. ETF inflows are an important supporting factor for price, but not the only determining variable. In our view, the macro interest rate environment, changes in leverage positions, and market sentiment can also affect short-term prices.
Q2: Does the Pectra upgrade have a direct impact on Ethereum's price?
No direct price-driving effect, but it constitutes a medium-to-long-term positive. In our view, changes like the Pectra upgrade improve network efficiency, but the price impact is indirect.
Q3: Is the current $2,800 for ETH a valid breakout or a short-term spike?
It cannot yet be confirmed as a valid breakout; we need to observe whether it can hold the $2,550 support. We see that ETH has currently broken out of the $1,800-$2,000 consolidation range from this summer. If the price stabilizes above $2,550 without a deep pullback, the validity of the breakout will be verified.

Conclusion
In our view, Ethereum's rebound to $2,800 is driven by a combination of ETF capital return, whale rotation, and a reversal in options sentiment. To hold $3,200 by month-end, it must cross three thresholds: the $2,700-$2,800 supply wall, a stronger ETH/BTC exchange rate, and macro interest rate pressure. Currently, $2,550 is the core support. If it holds, $3,000-$3,200 will be the next test target.
Disclaimer: Readers are strictly advised to comply with local laws and regulations. This article is compiled based on public market data for reference and educational purposes only, and does not constitute investment advice. Follow CoinMeta for the latest updates.