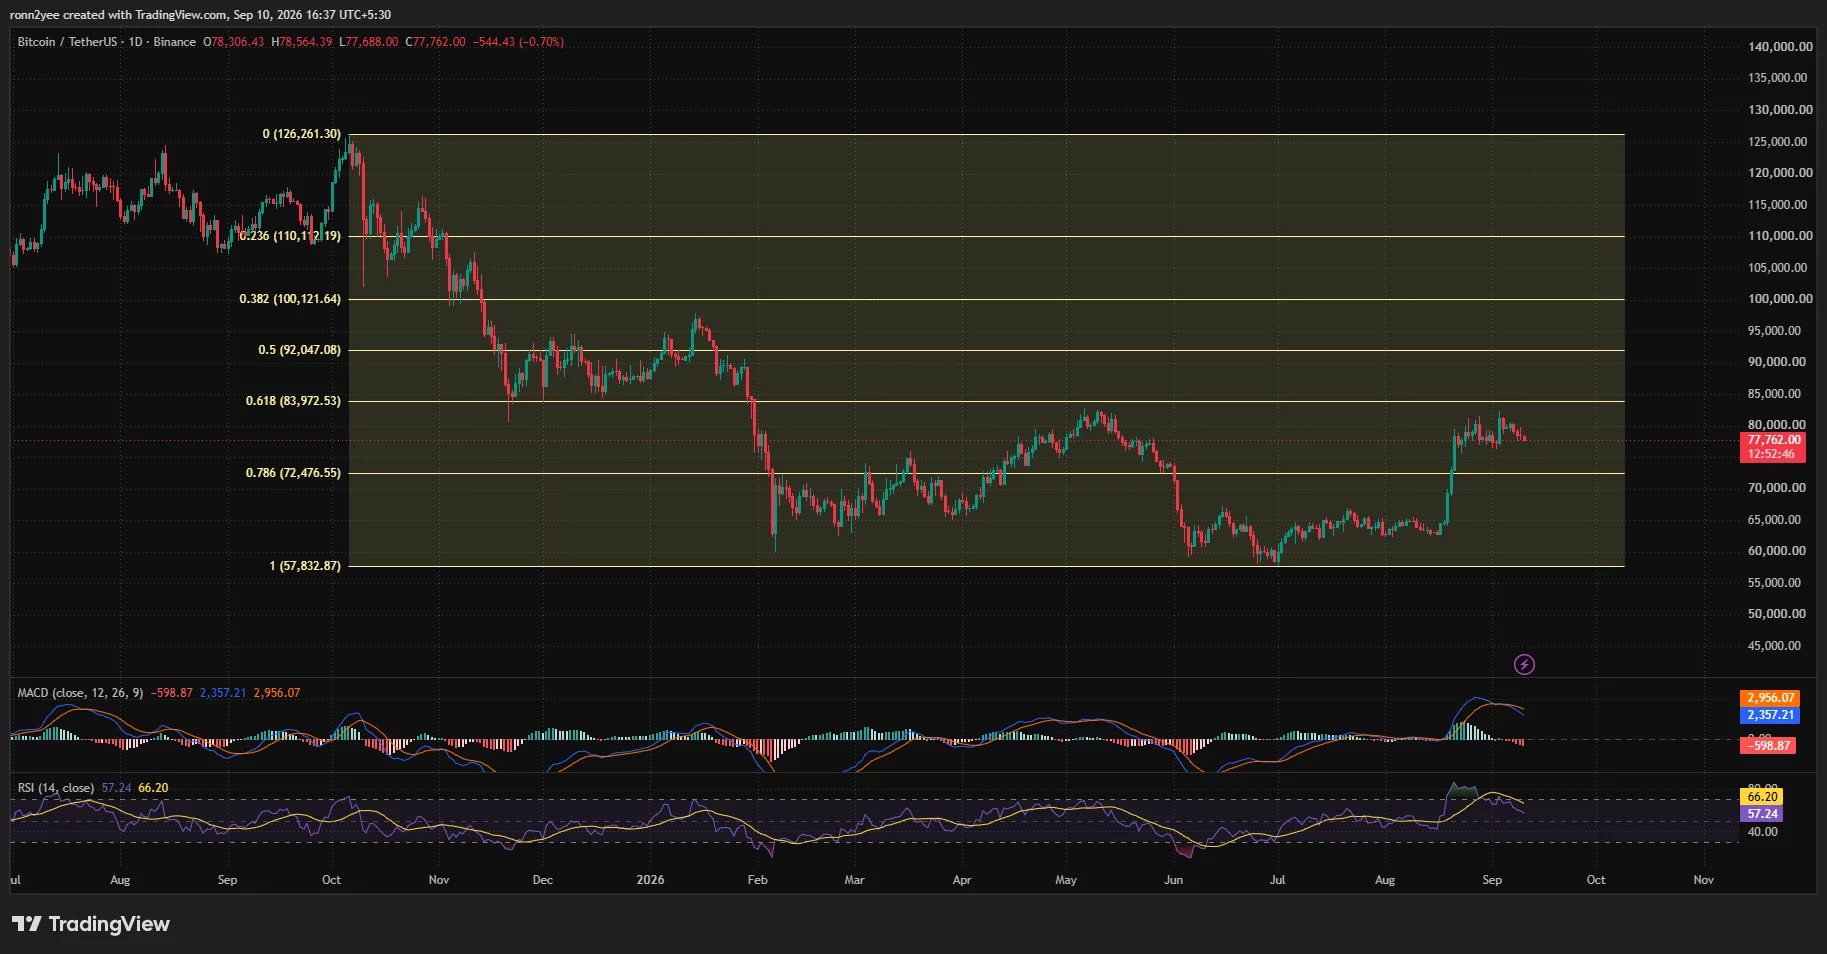





Bitcoin fell below $78,000 on September 10, and the market became more cautious ahead of the Federal Reserve's interest rate meeting in September. U.S. producer inflation in August was higher than expected, coupled with capital outflows from spot Bitcoin ETF, putting pressure on risky assets.
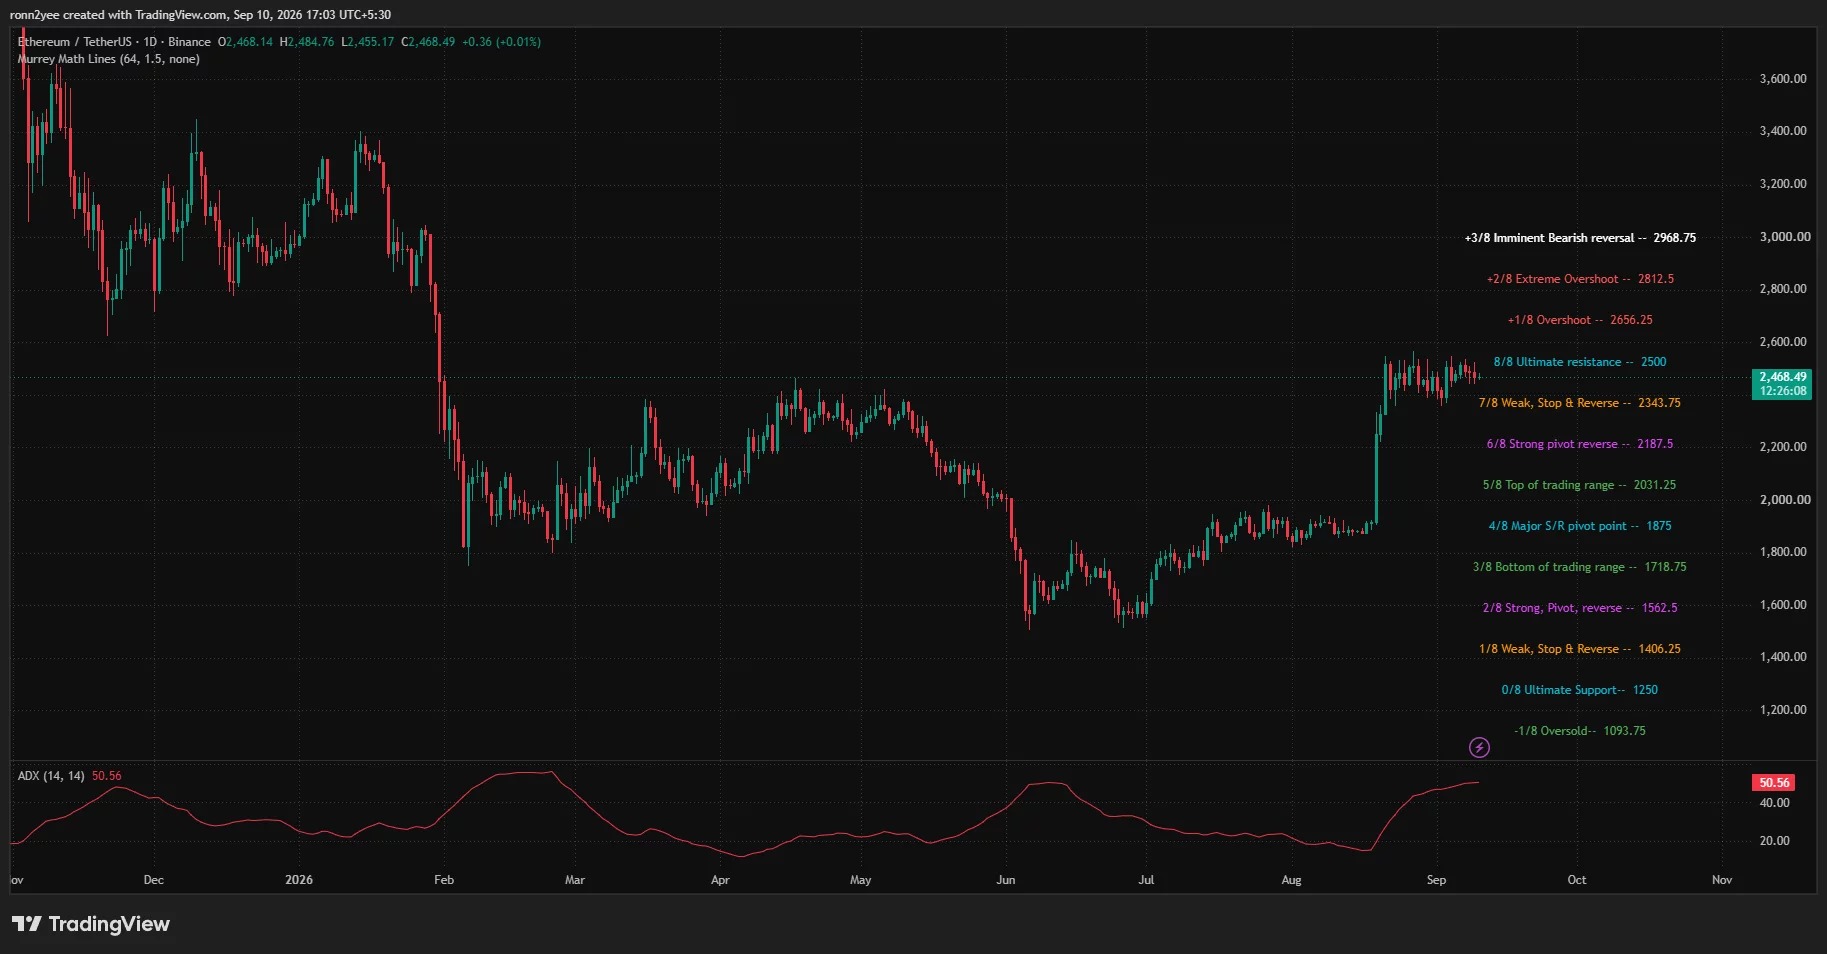
As of press time, Bitcoin was trading at $77,278, with a daily decline of 1.31%, and at one point during the session it fell to $76,676. During the same period, the total market value of the crypto market declined by 2.01% over 24 hours to $2.65 trillion. Ethereum was trading at around $2,420, while XRP and Solana were trading near $1.36 and $99.31 respectively.
Inflation data fuels a wait-and-see attitude
In the United States, in August PPI, inflation rose year-on-year to 5.4%, higher than the market's expectation of 5.3%; the core PPI inflation rate climbed to 4.6%, reaching a level not seen since June 2026. Following the release of these data, concerns in the market regarding the Federal Reserve's continued interest rate hikes at its meeting on September 15-16 intensified.
CME FedWatch Data shows that the probability of a 25-basis-point interest rate hike in September is around 60%. If this comes to fruition, the federal funds rate target range will rise from 3.50% to 3.75% to 3.75% to 4.00%. Against this backdrop, an increase in the yields of cash and U.S. Treasuries typically weakens the attractiveness of risk assets such as crypto.
$76,400 becomes a near-term support level
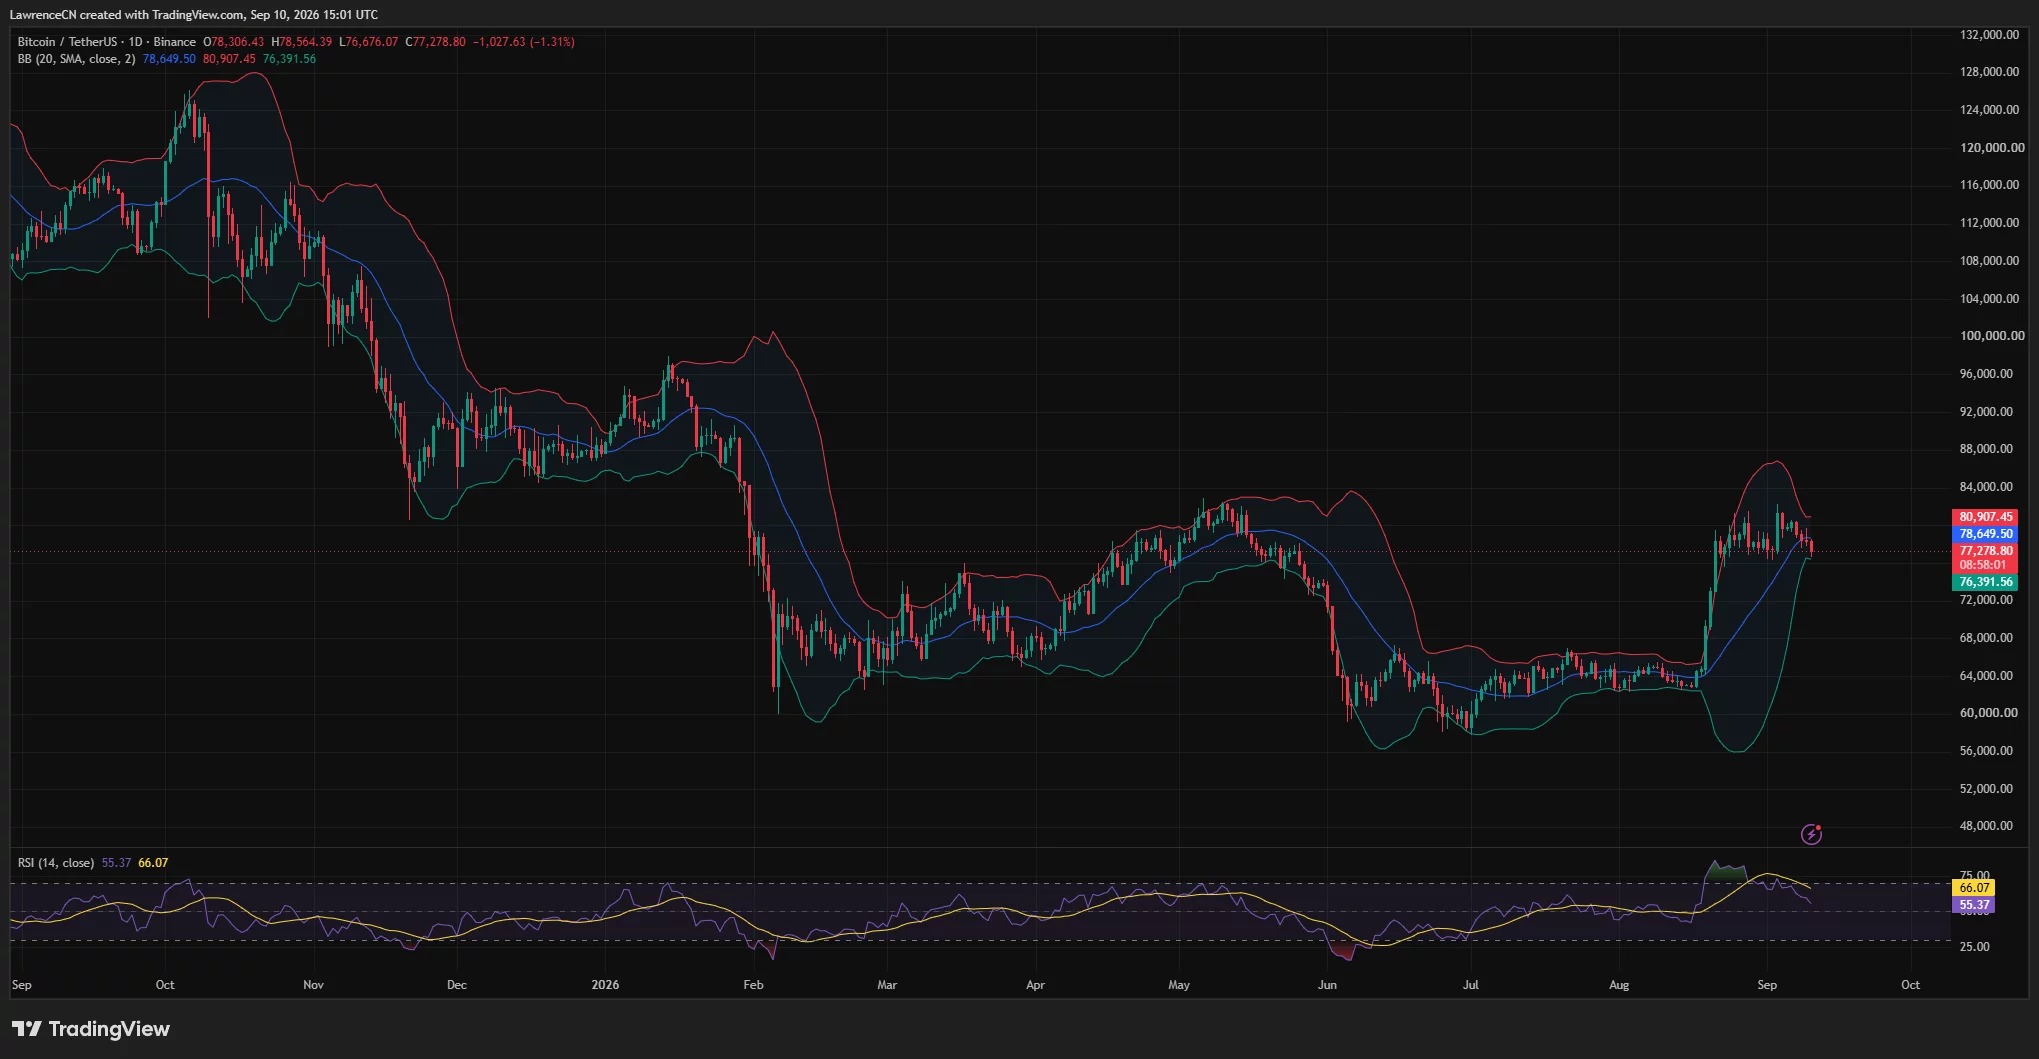
From a daily perspective, Bitcoin has fallen below the middle band of the Bollinger Bands at $78,650, and the short-term focus has shifted to the lower band at around $76,392. This level is slightly below the intraday low of the day and has become the most direct support level at present.
If the daily close falls below $76,392, it would indicate that the price has further broken below the lower edge of its trading range, and the integer level of $76,000 will be put to the test. If buyers fail to hold this level, the next support areas could be around $75,000 and $74,000.
However, as long as the level of $76,392 is not effectively broken below, Bitcoin remains within its current range of fluctuations. If the price rebounds, it will first need to exceed $78,650 again, and then the resistance levels above will be at $80,907, followed by the previous range of $82,000 to $82,300.
Liquidity for settlement is concentrated around $80,000
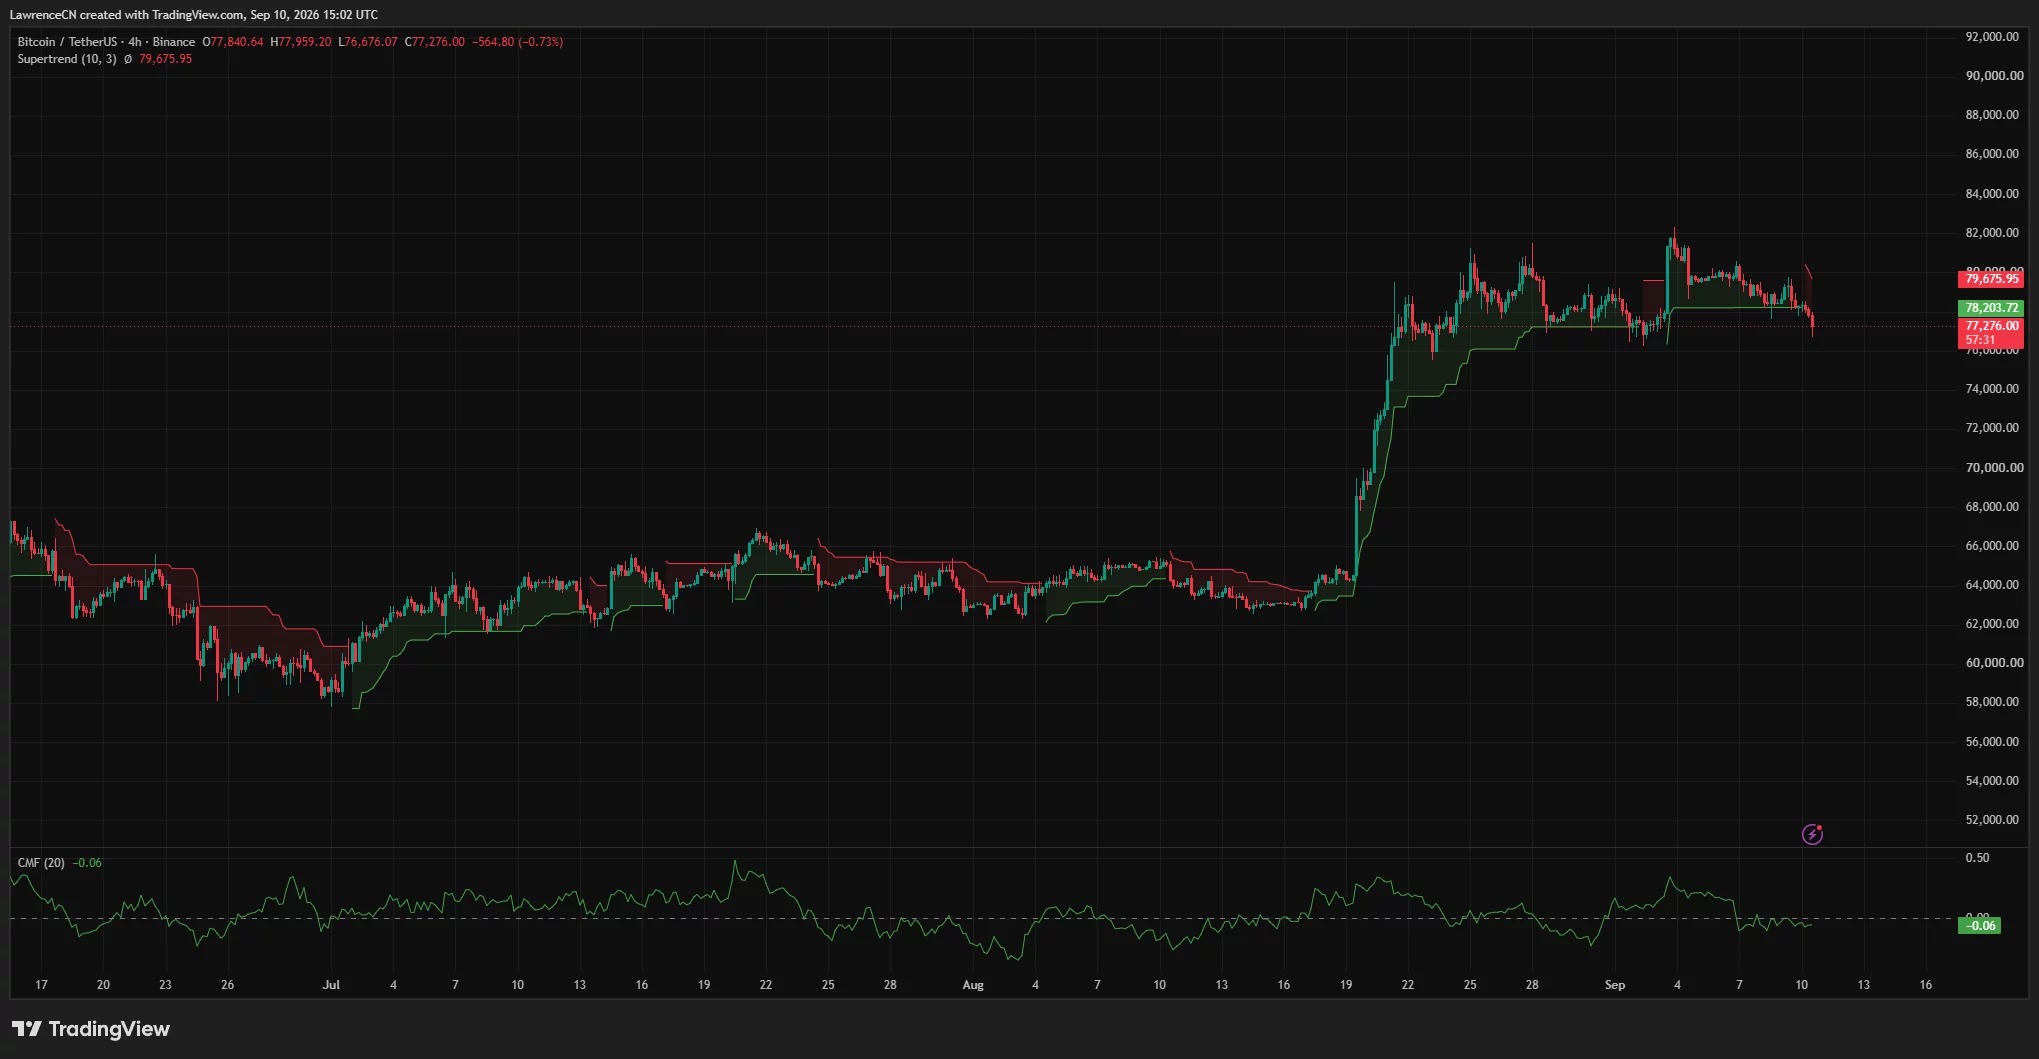
On a 4-hour time frame, Bitcoin has fallen below its previous support level of around $78,204 (Supertrend), with indicators turning bearish. The new resistance level above is around $79,676. Meanwhile, the 4-hour Chaikin Money Flow indicator has dropped to -0.06, indicating that selling pressure and capital outflows have been stronger than buying during the statistical period.
CoinGlass The three-day settlement heat map shows that there is a significant amount of liquidity concentrated in the range of $79,500 to $80,000 above Bitcoin, and there is also a clear settlement zone around $79,200. If the price returns above $78,200, the pressure to close short positions could push the market towards these areas.
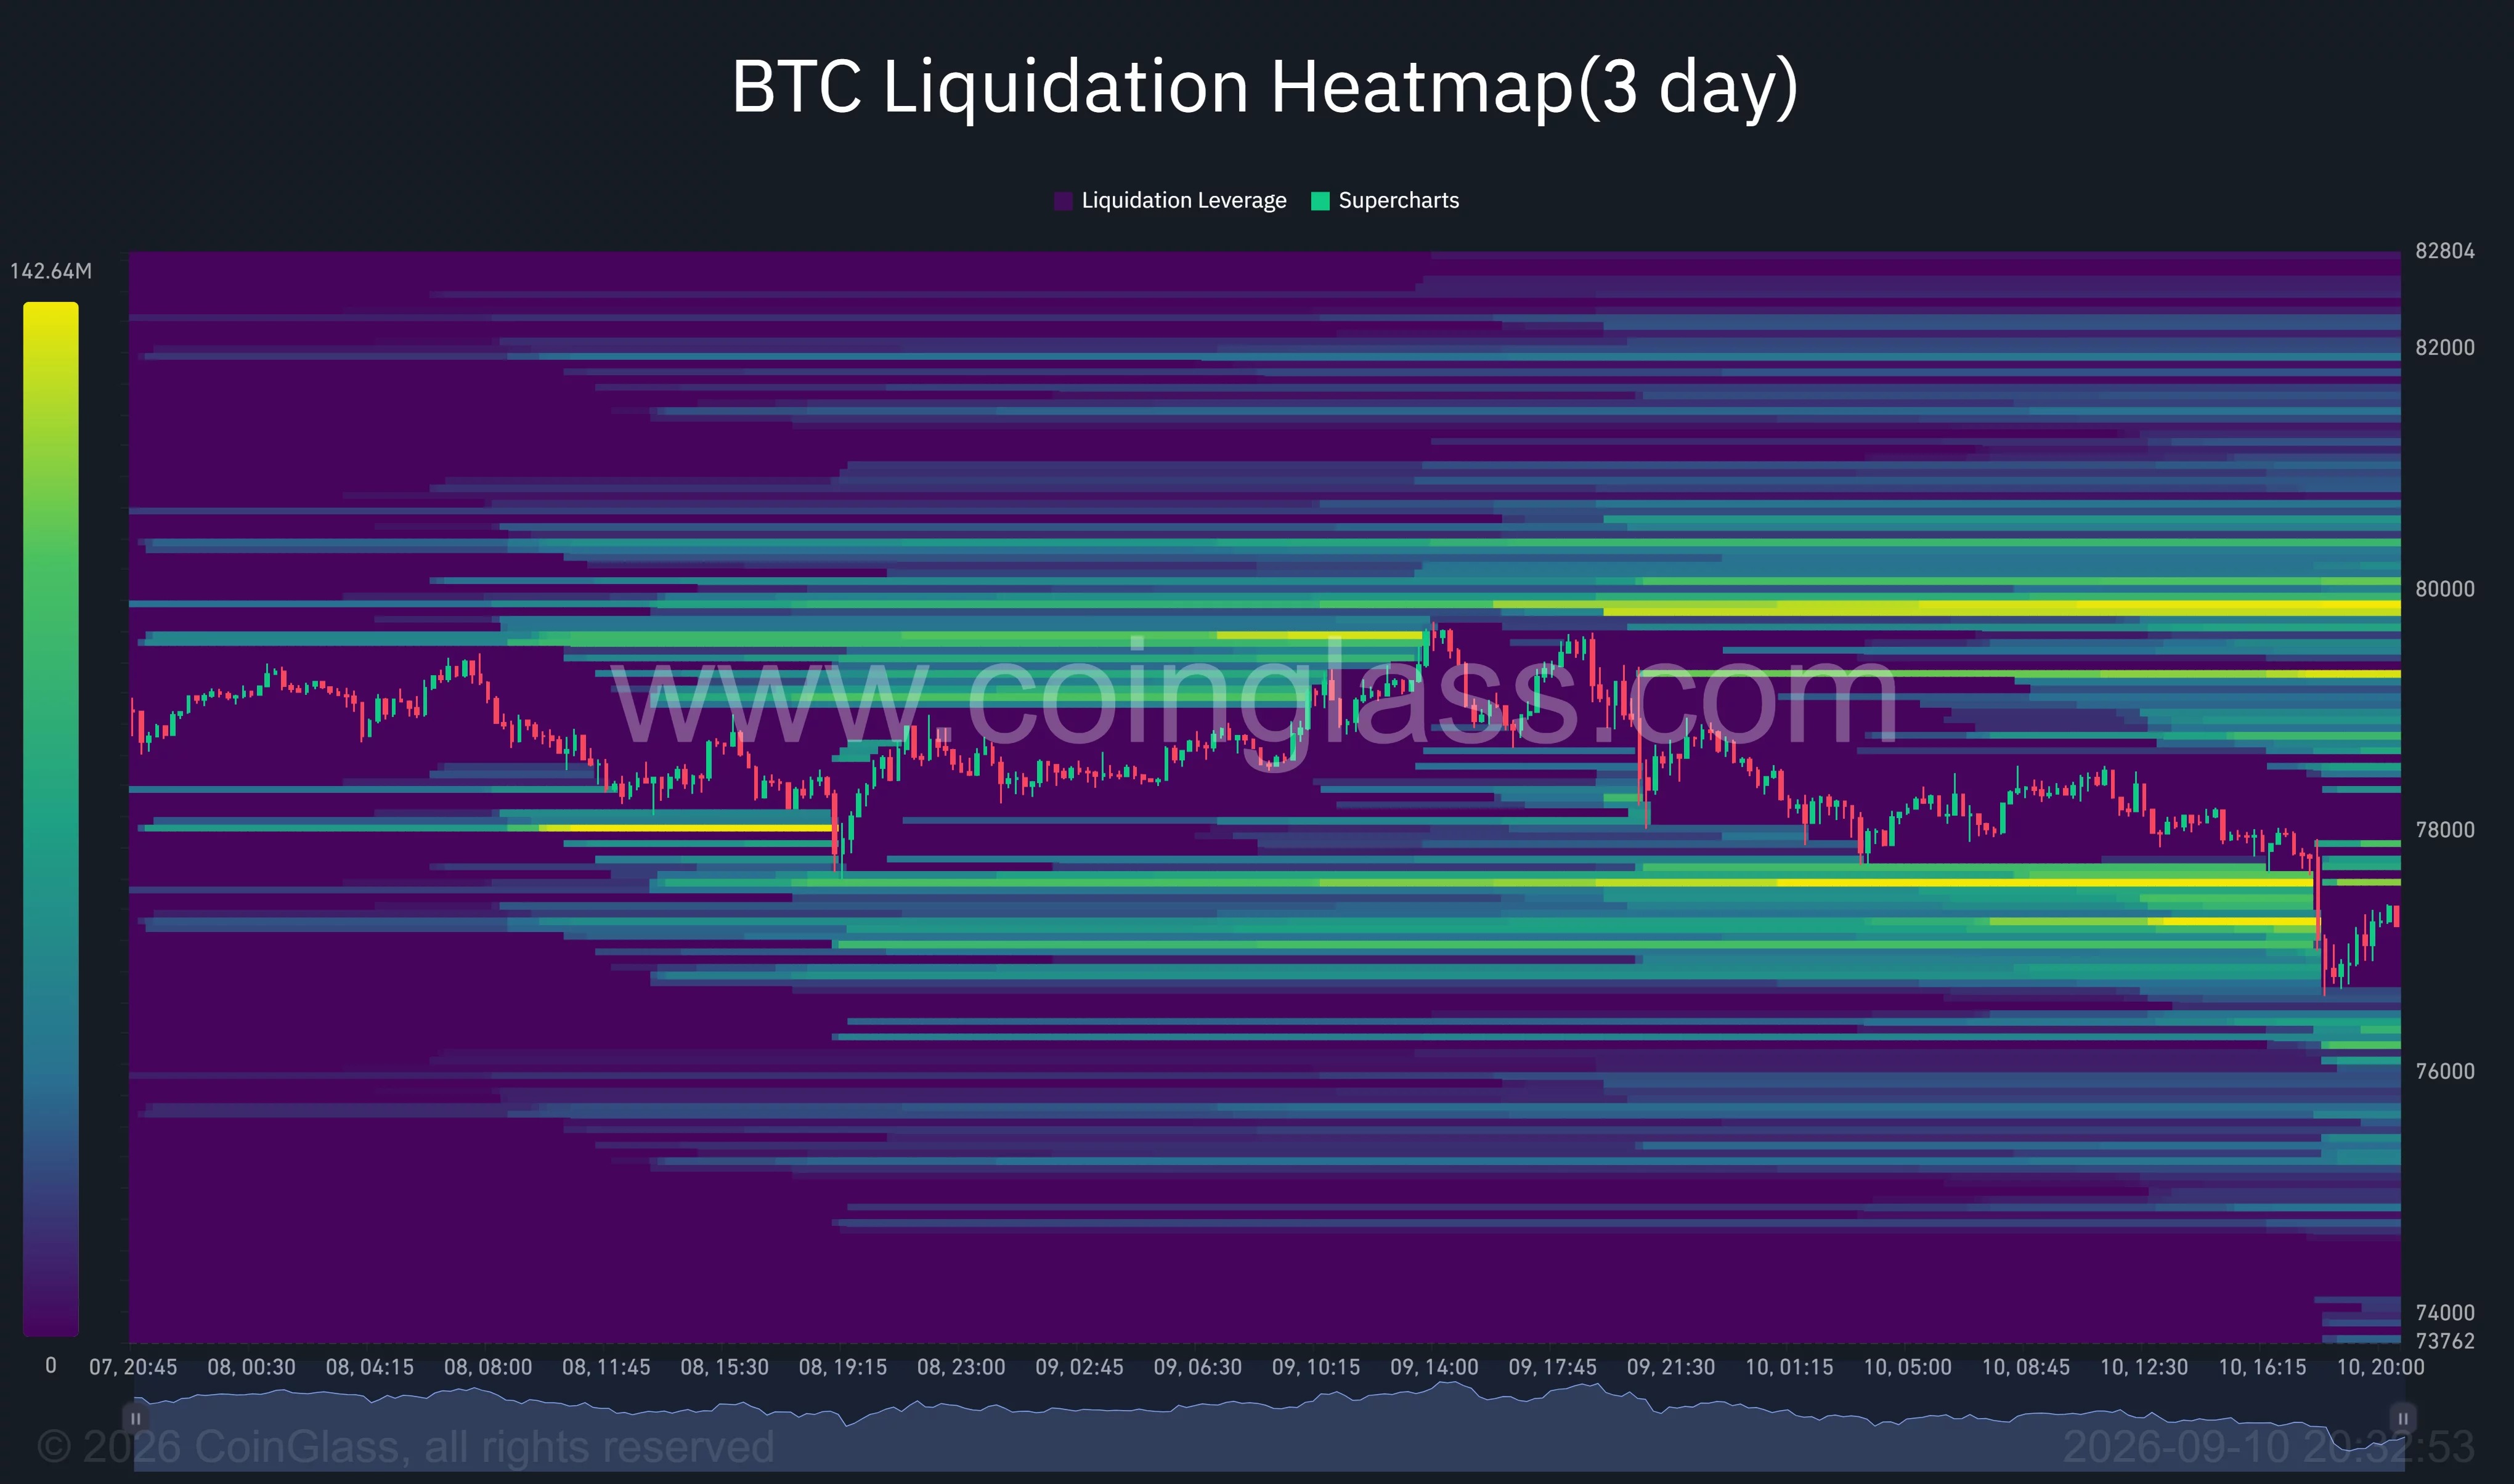
On the other hand, US spot Bitcoin ETF recorded a net outflow of $201.9 million on August 29, ending a streak of 9 consecutive trading days of net inflows. However, looking at the entire week, there was still a net inflow of $924.5 million. In the short term, the changes in ETF funds and the expectations regarding the Federal Reserve's meetings remain the two main concerns for the market.