






Foreign media analysis indicates that on September 7th, the crypto market exhibited a divergent trend. XRP continued to consolidate at high levels, SOL maintained its rebound structure, HYPE continued to outperform the broader market, while Bitcoin faced repeated resistance around $80,000. Short-term funds were more concerned with whether various assets could hold their key support levels.
XRP Focus on the $1.35 support level
The article suggests that after a rapid upward movement in August, XRP is still in a consolidation phase. The current price remains above the main moving averages, but there has not yet been a new round of sustained buying pressure that would lead to a breakthrough.
Among them, the range of $1.35 to $1.36 is considered the most important support level. This area has been tested several times recently, and there has not yet been a clear breakdown. The initial resistance above is at $1.45; if the daily chart manages to regain this level, the market may once again focus on the range of $1.50 to $1.55.
From the perspective of momentum indicators, the relative strength indicator for XRP is around 62, which has fallen from the high levels seen during the breakout in August. Based on this, the article suggests that there is still room for prices to continue to rise. However, if they fall below $1.35, the market may begin to pay attention to the levels of $1.32 and $1.23.
SOL Approaching $110 Resistance
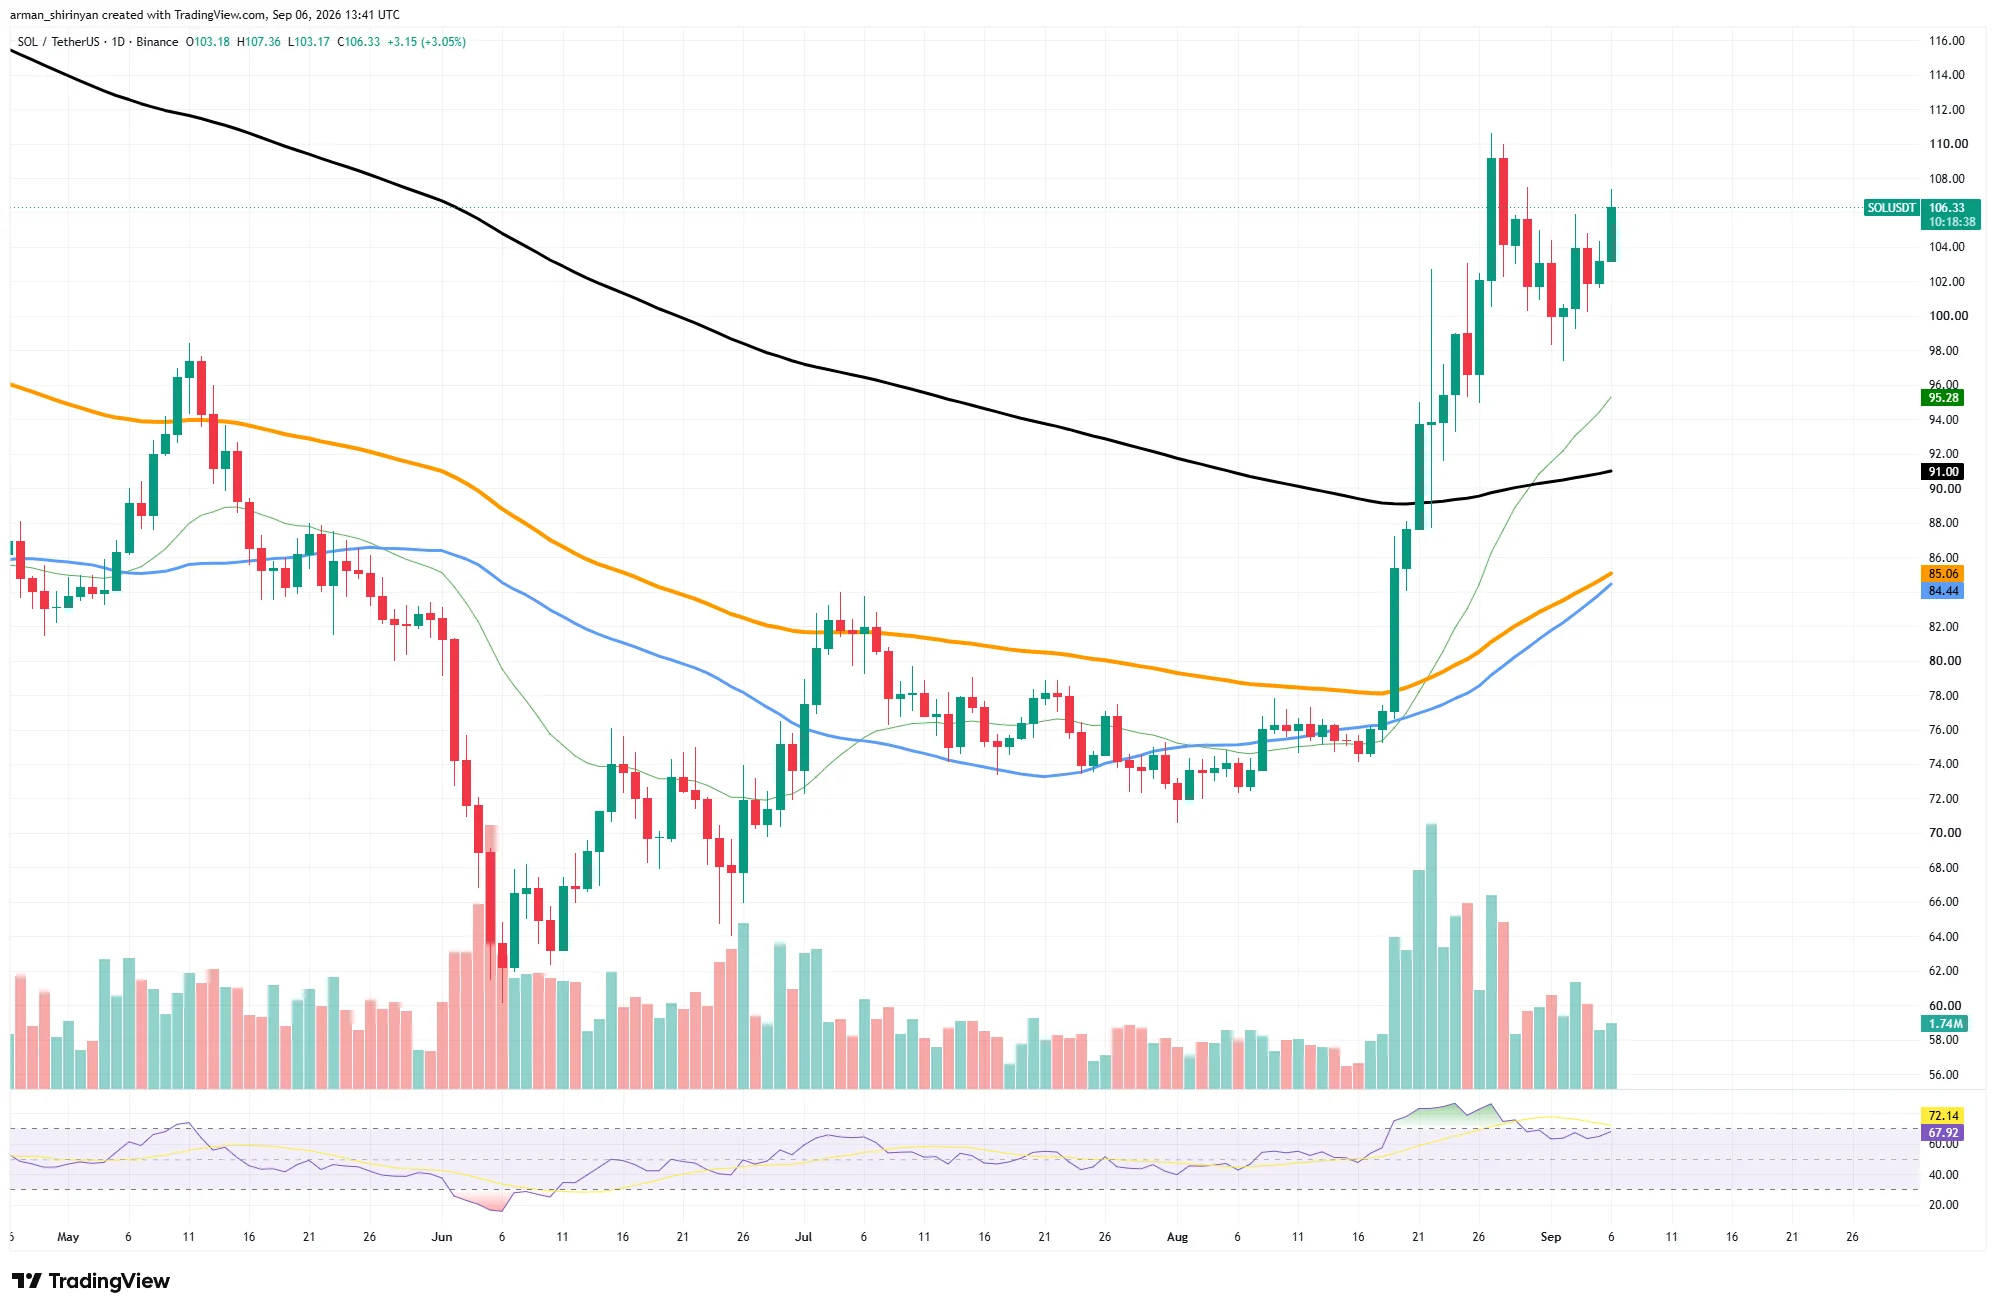
SOL had a daily increase of over 3%, with the price around $106.5. The article states that SOL is still in a relatively complete recovery phase and has returned above the main moving average.
In the short term, the range of $108 to $110 is the current main resistance zone. SOL touched this area during the rebound at the end of August, but the buying pressure has not yet managed to make a valid breakthrough. The support below is concentrated between $100 and $102; if there is a further decline, the market will also pay attention to the 20-day moving average around $95.3, as well as the 200-day moving average around $91.
The article also mentions that the relative strength indicator for SOL has approached 68, indicating that although the price has cooled down from its rapid rise earlier on, it is once again approaching a relatively hot range. If it can hold above $100, the overall structure remains strong; if it breaks through $110, the signal for a continuation of the rebound will be even clearer.
HYPE Testing the $90 level
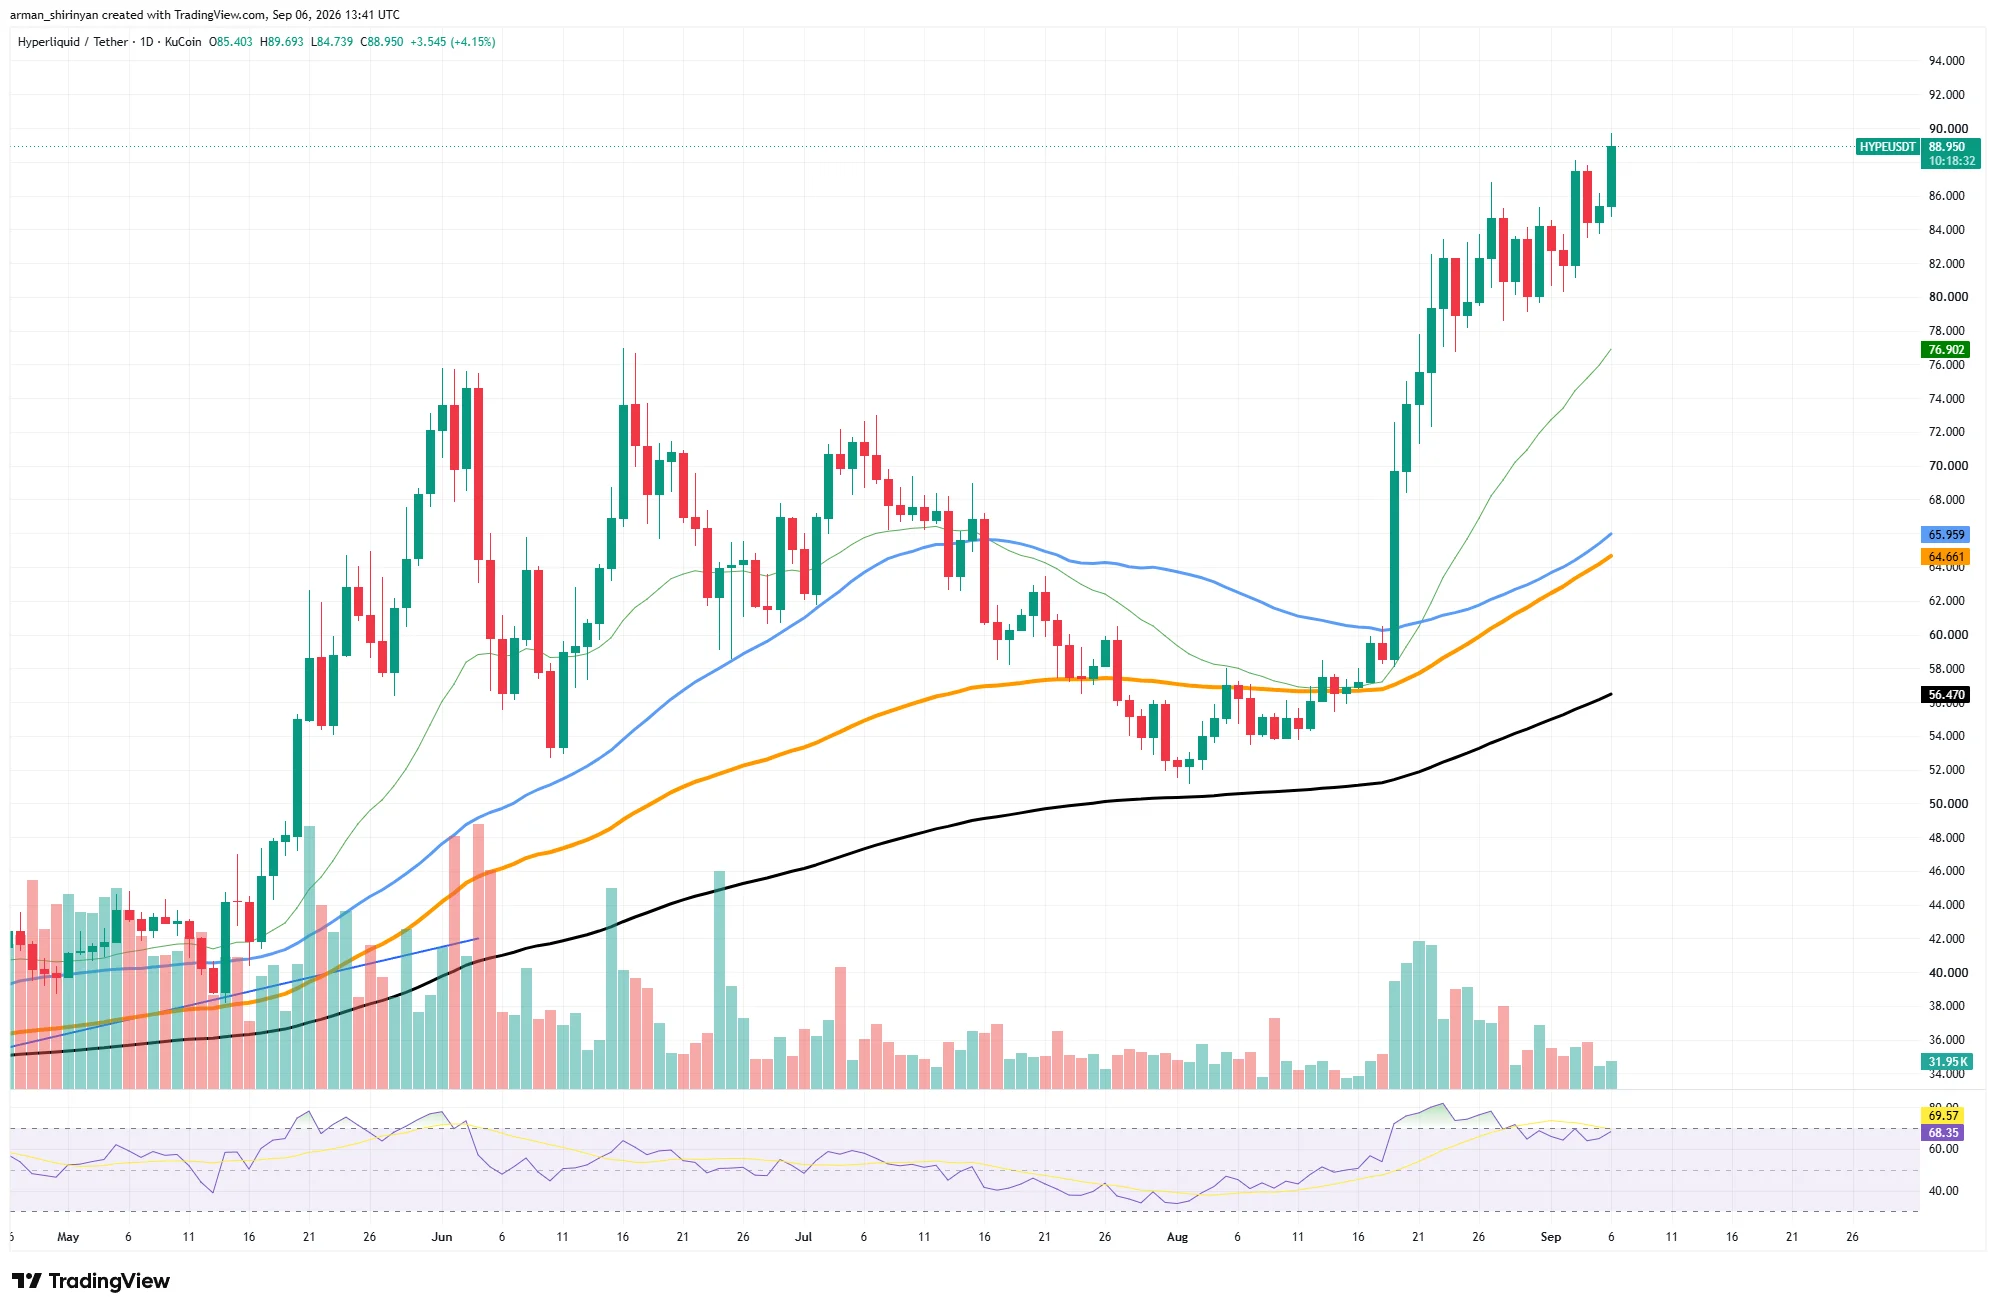
Among several assets, HYPE remains the strongest performer. The article states that since August 18th, when its price was still below $60, the token has continued to rise and is now at around $89.
From a technical perspective, $90 is the current integer level that attracts the most attention. If the price effectively breaks through this level, the market may then watch the range of $92 to $95. At the same time, the distance between HYPE and the main moving averages is also widening, indicating that the magnitude of this upward movement is already significant.
The article suggests that the current primary support level for HYPE is between $84 and $85, with the 20-day moving average area below that at around $77 to $80. The Relative Strength Index (RSI) is around 68.5, indicating strong momentum, although the growth rate has slowed down during the new high formation. The likelihood of a short-term consolidation is also increasing.
Bitcoin under pressure around $80,000
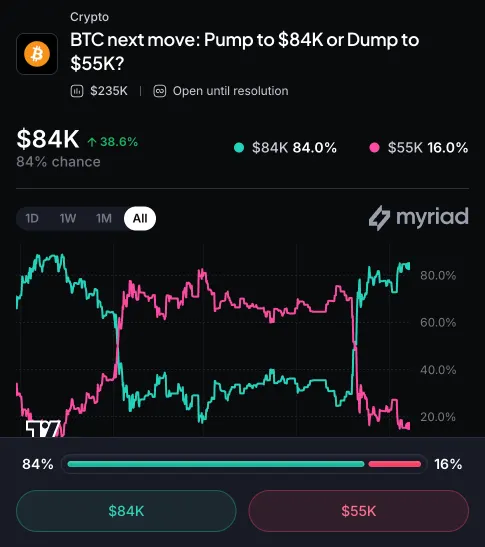
After breaking above around $63,000 in August, Bitcoin is currently consolidating around the $80,000 level. The article points out that the price has attempted several times to stay above $81,000, but the sustainability has not been sufficient, with the latest level being close to $79,960.
Judging from the text, the current trend seems more like a consolidation at a high level, rather than a clear reversal. The range of $77,000 to $78,000 remains the main demand area, while the recent resistance above that is concentrated between $81,000 and $82,000.
The article also mentions that Bitcoin is still significantly above the main moving averages, with a 20-day moving average of around $75,124 and a 200-day moving average of around $72,638, indicating that the overall structure has not been disrupted since the breakout in August. If the daily price breaks through $82,000, the market could further target $84,000 to $85,000; if it falls back, $77,000 remains the first key support level.